MOSFET Transistor Modeling
Topics
- MOSFET device behavior,
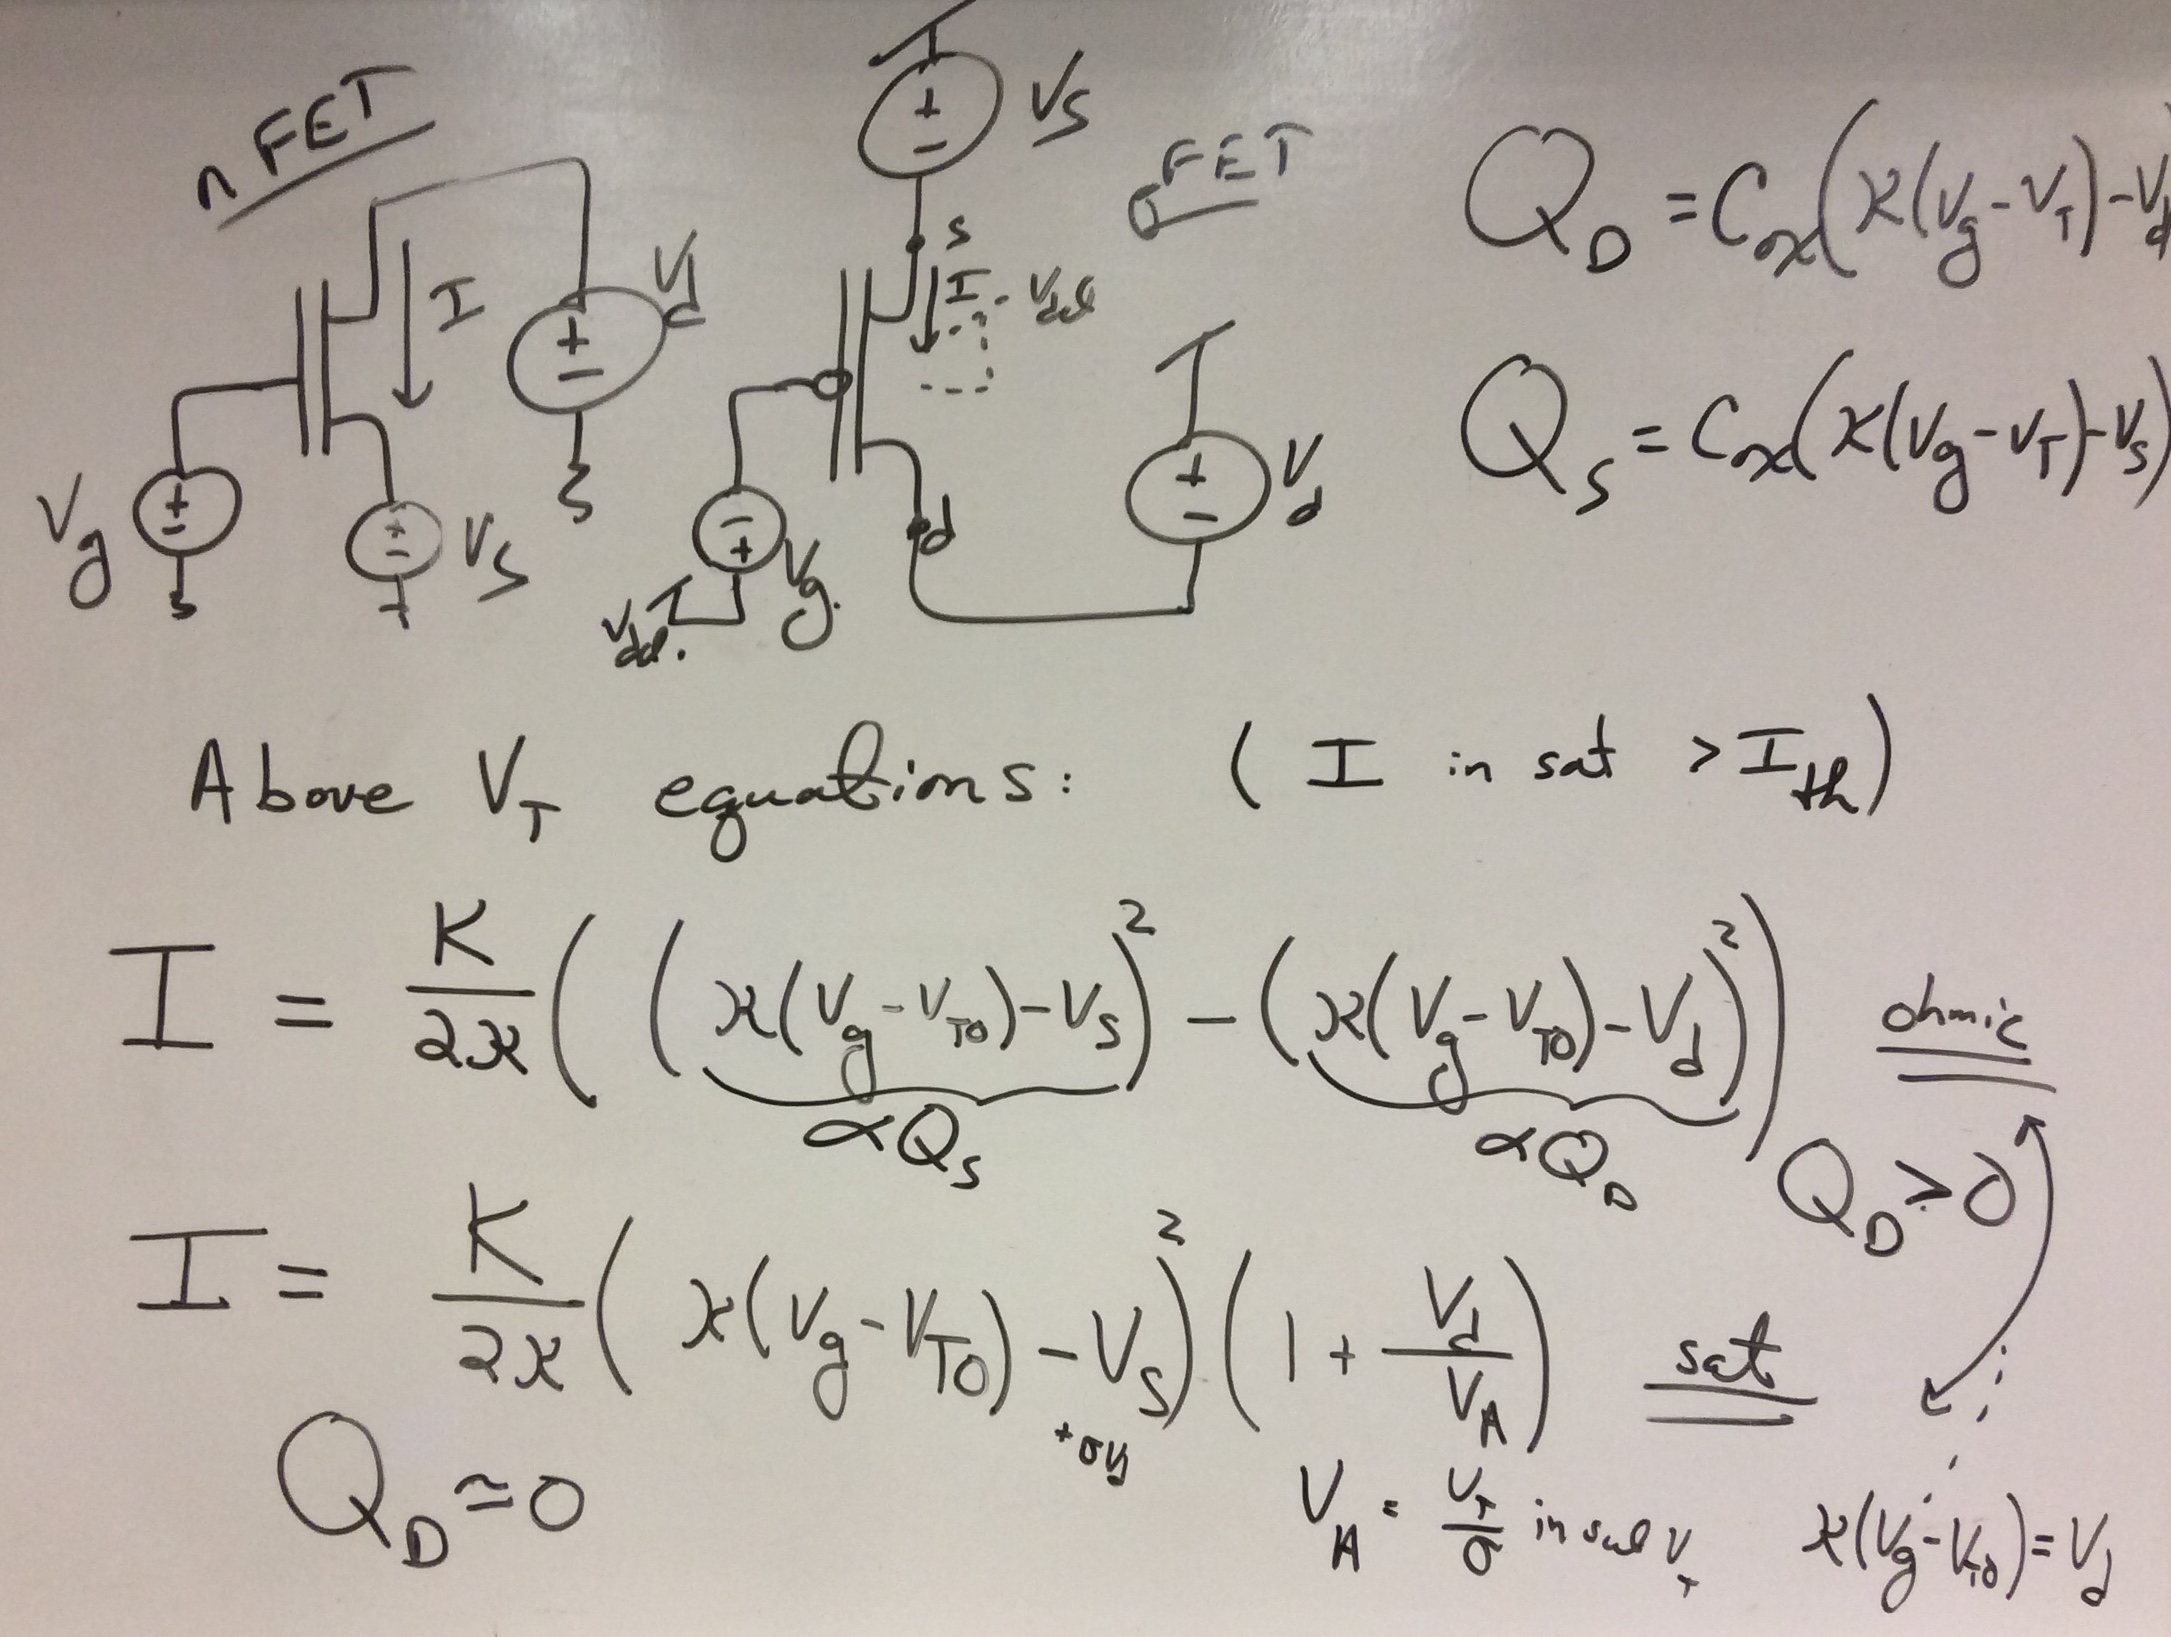
focusing on SubThreshold and Above Threshold Operation
- MOSFET as an approximate current source
- Early Effect / DIBL ("sigma") in MOSFET devices
A few critical points to remember:
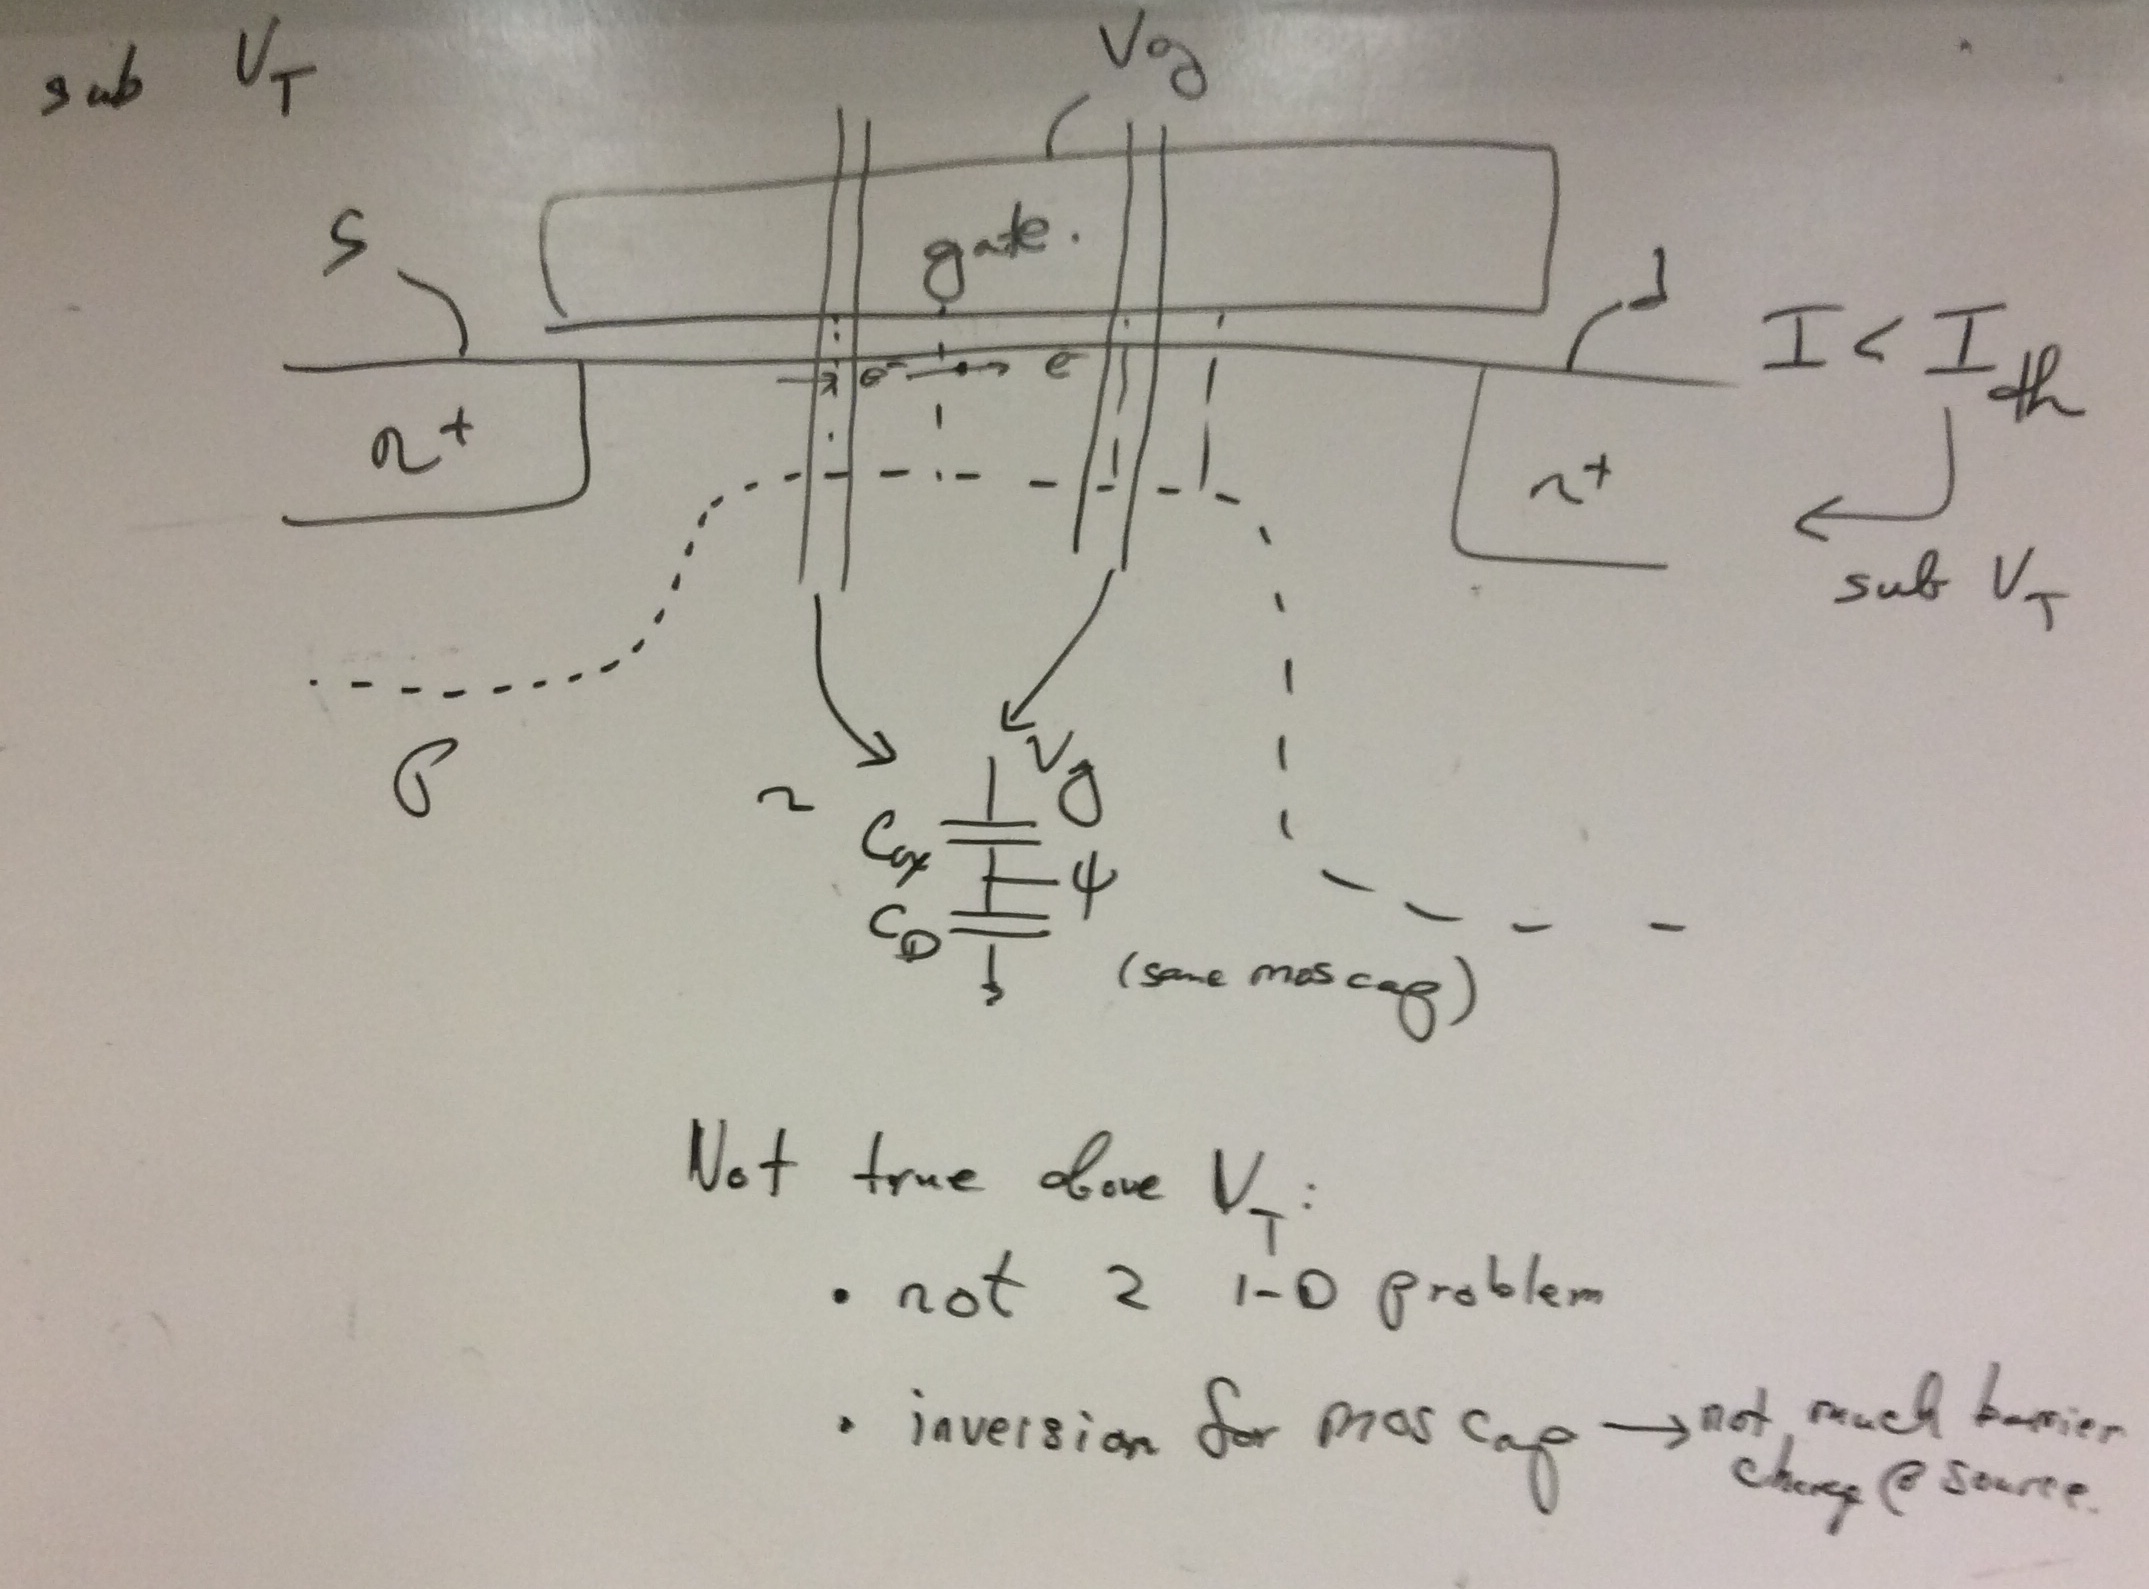
- Our approach for MOSFET devices starts from a sub threshold perspective
and then includes the above threshold operation as a limiting case of its operation.
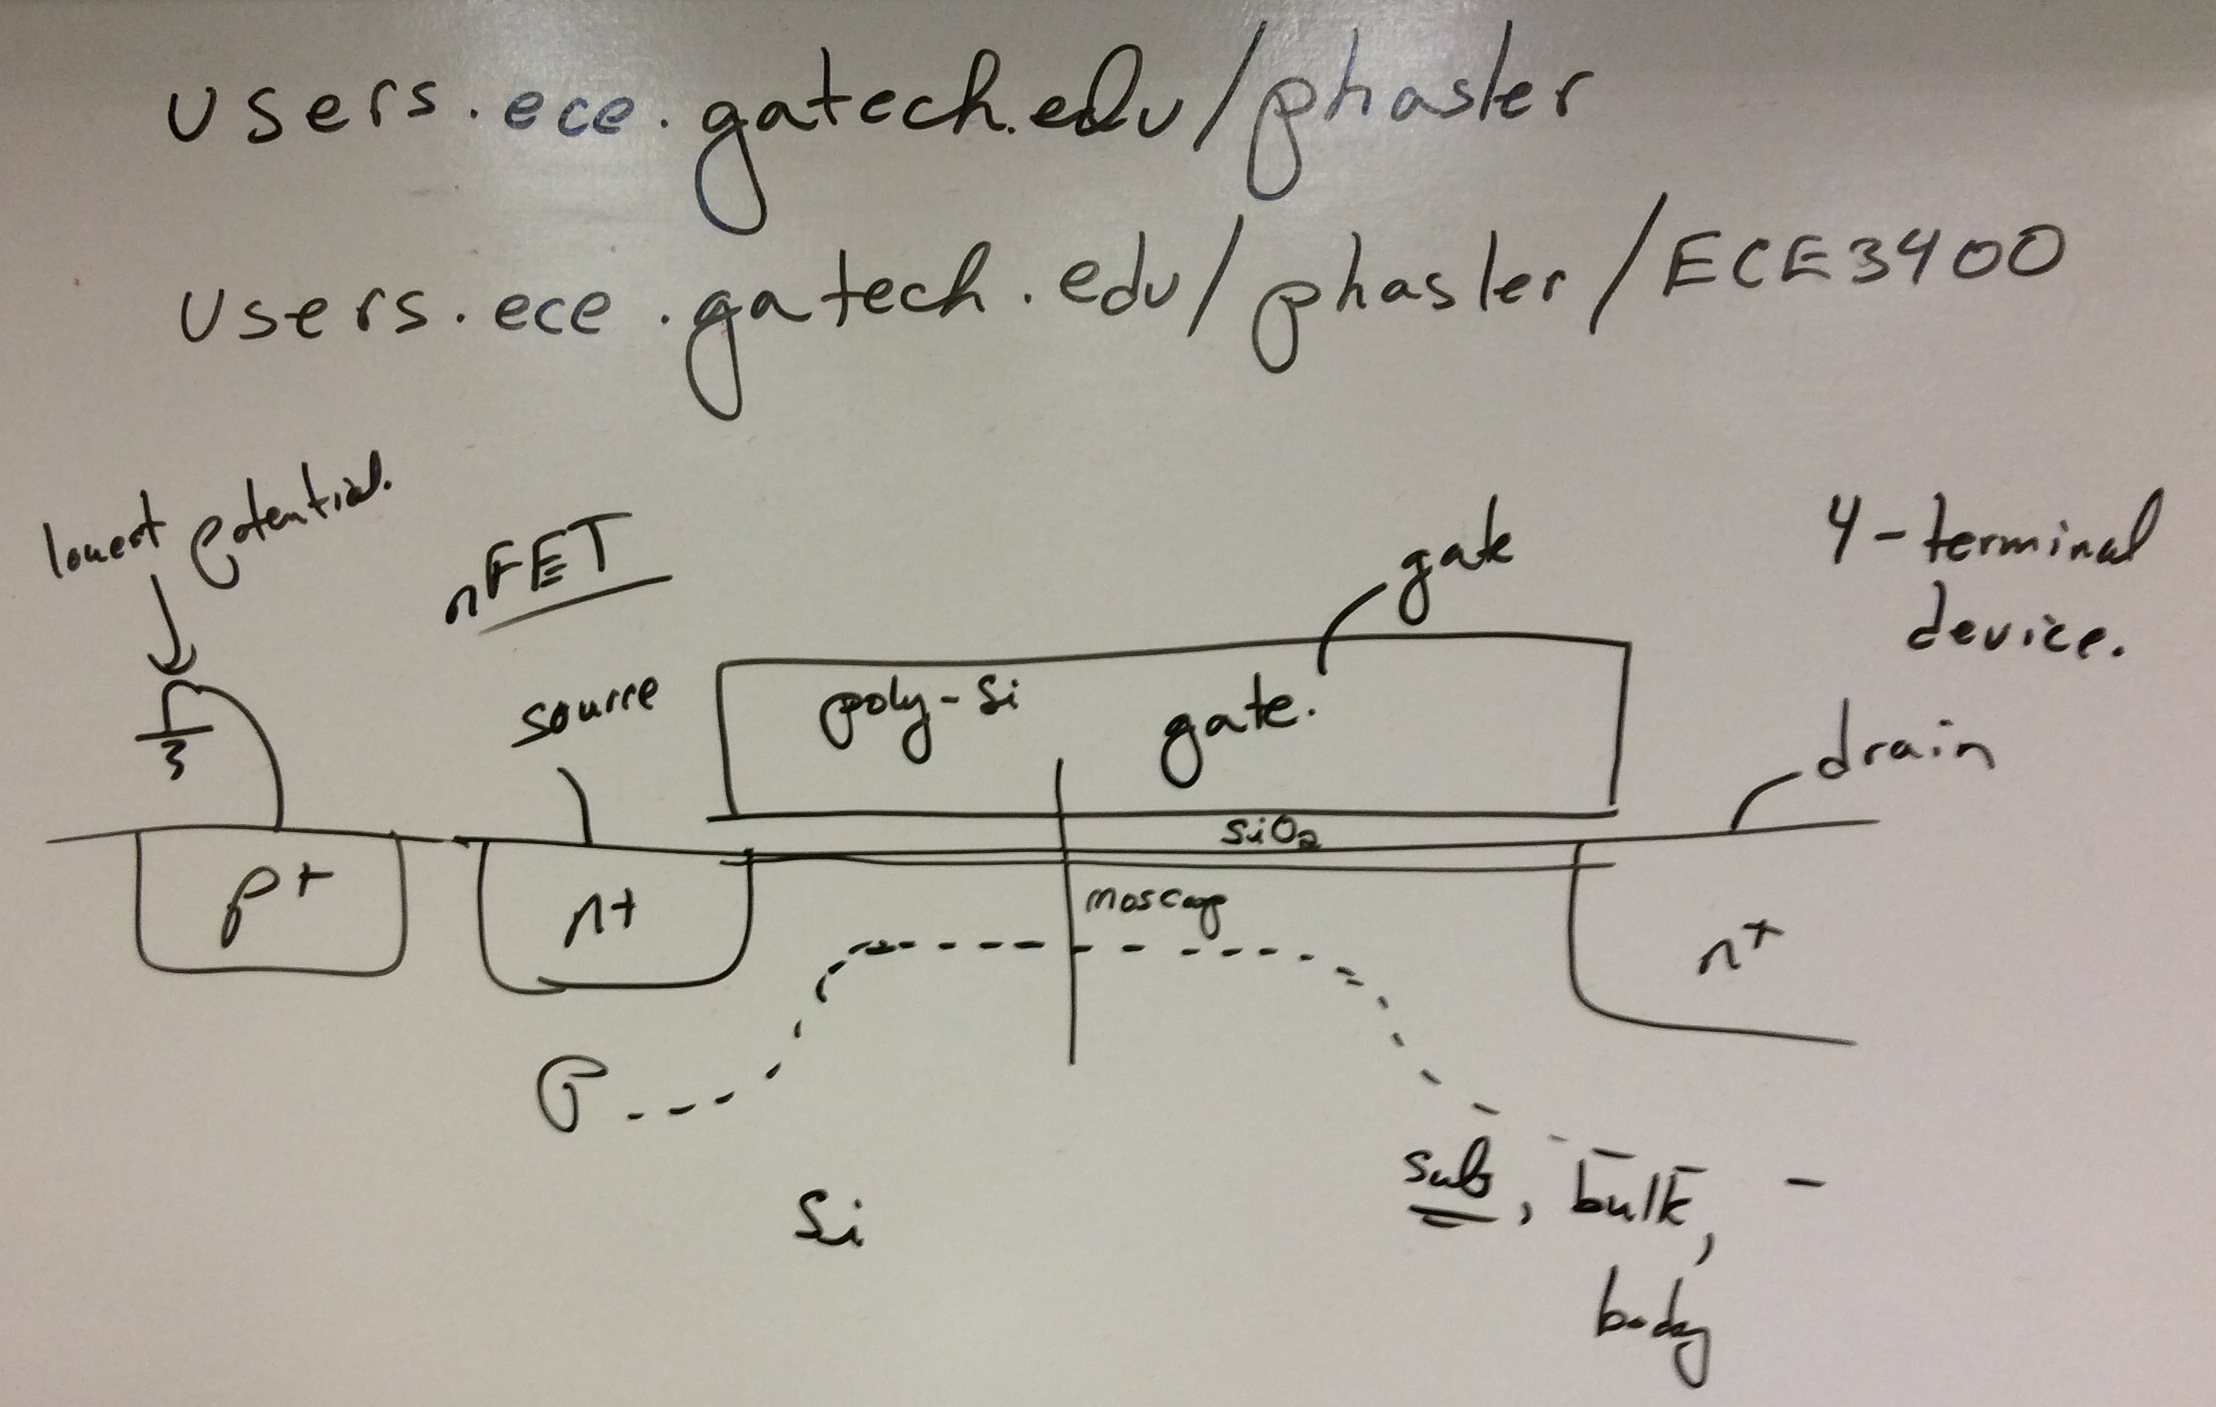
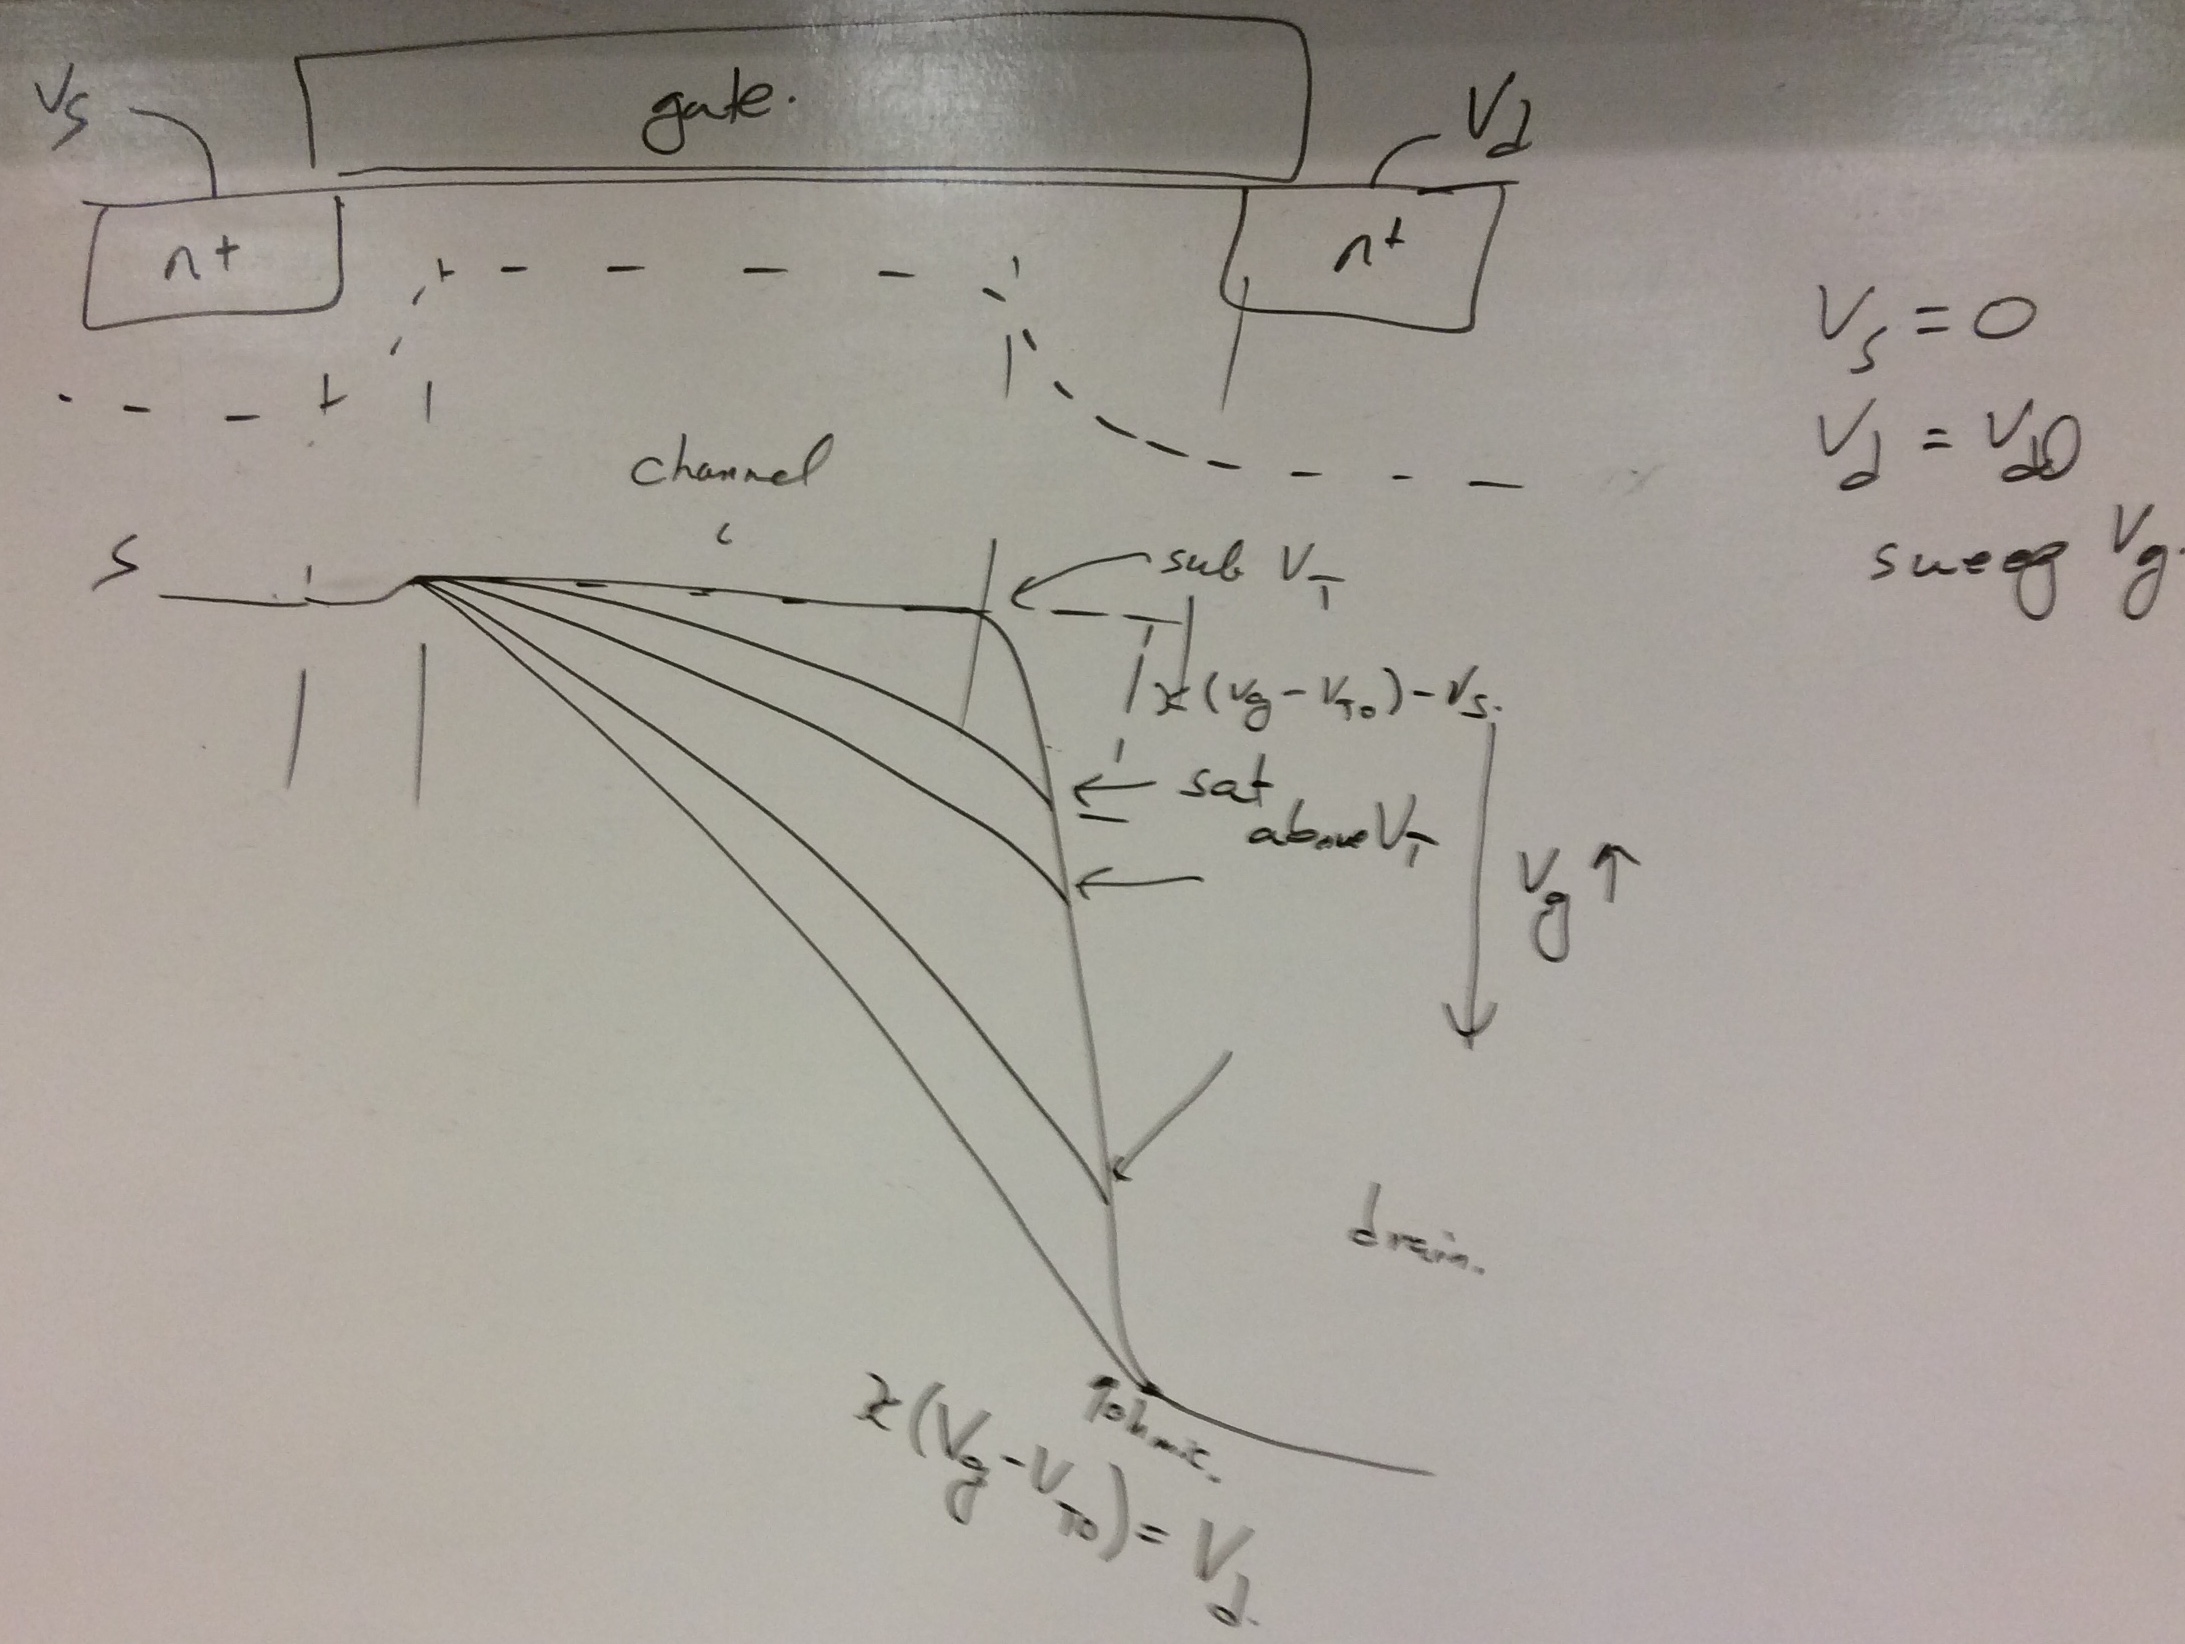
- Remember that the source (Vs) and drain (Vd) terminals,
which are interchangeable in terms of their operation,
have a direct connection to their part of the band diagram
(degenerately doped regions make fermi level = conduction band).
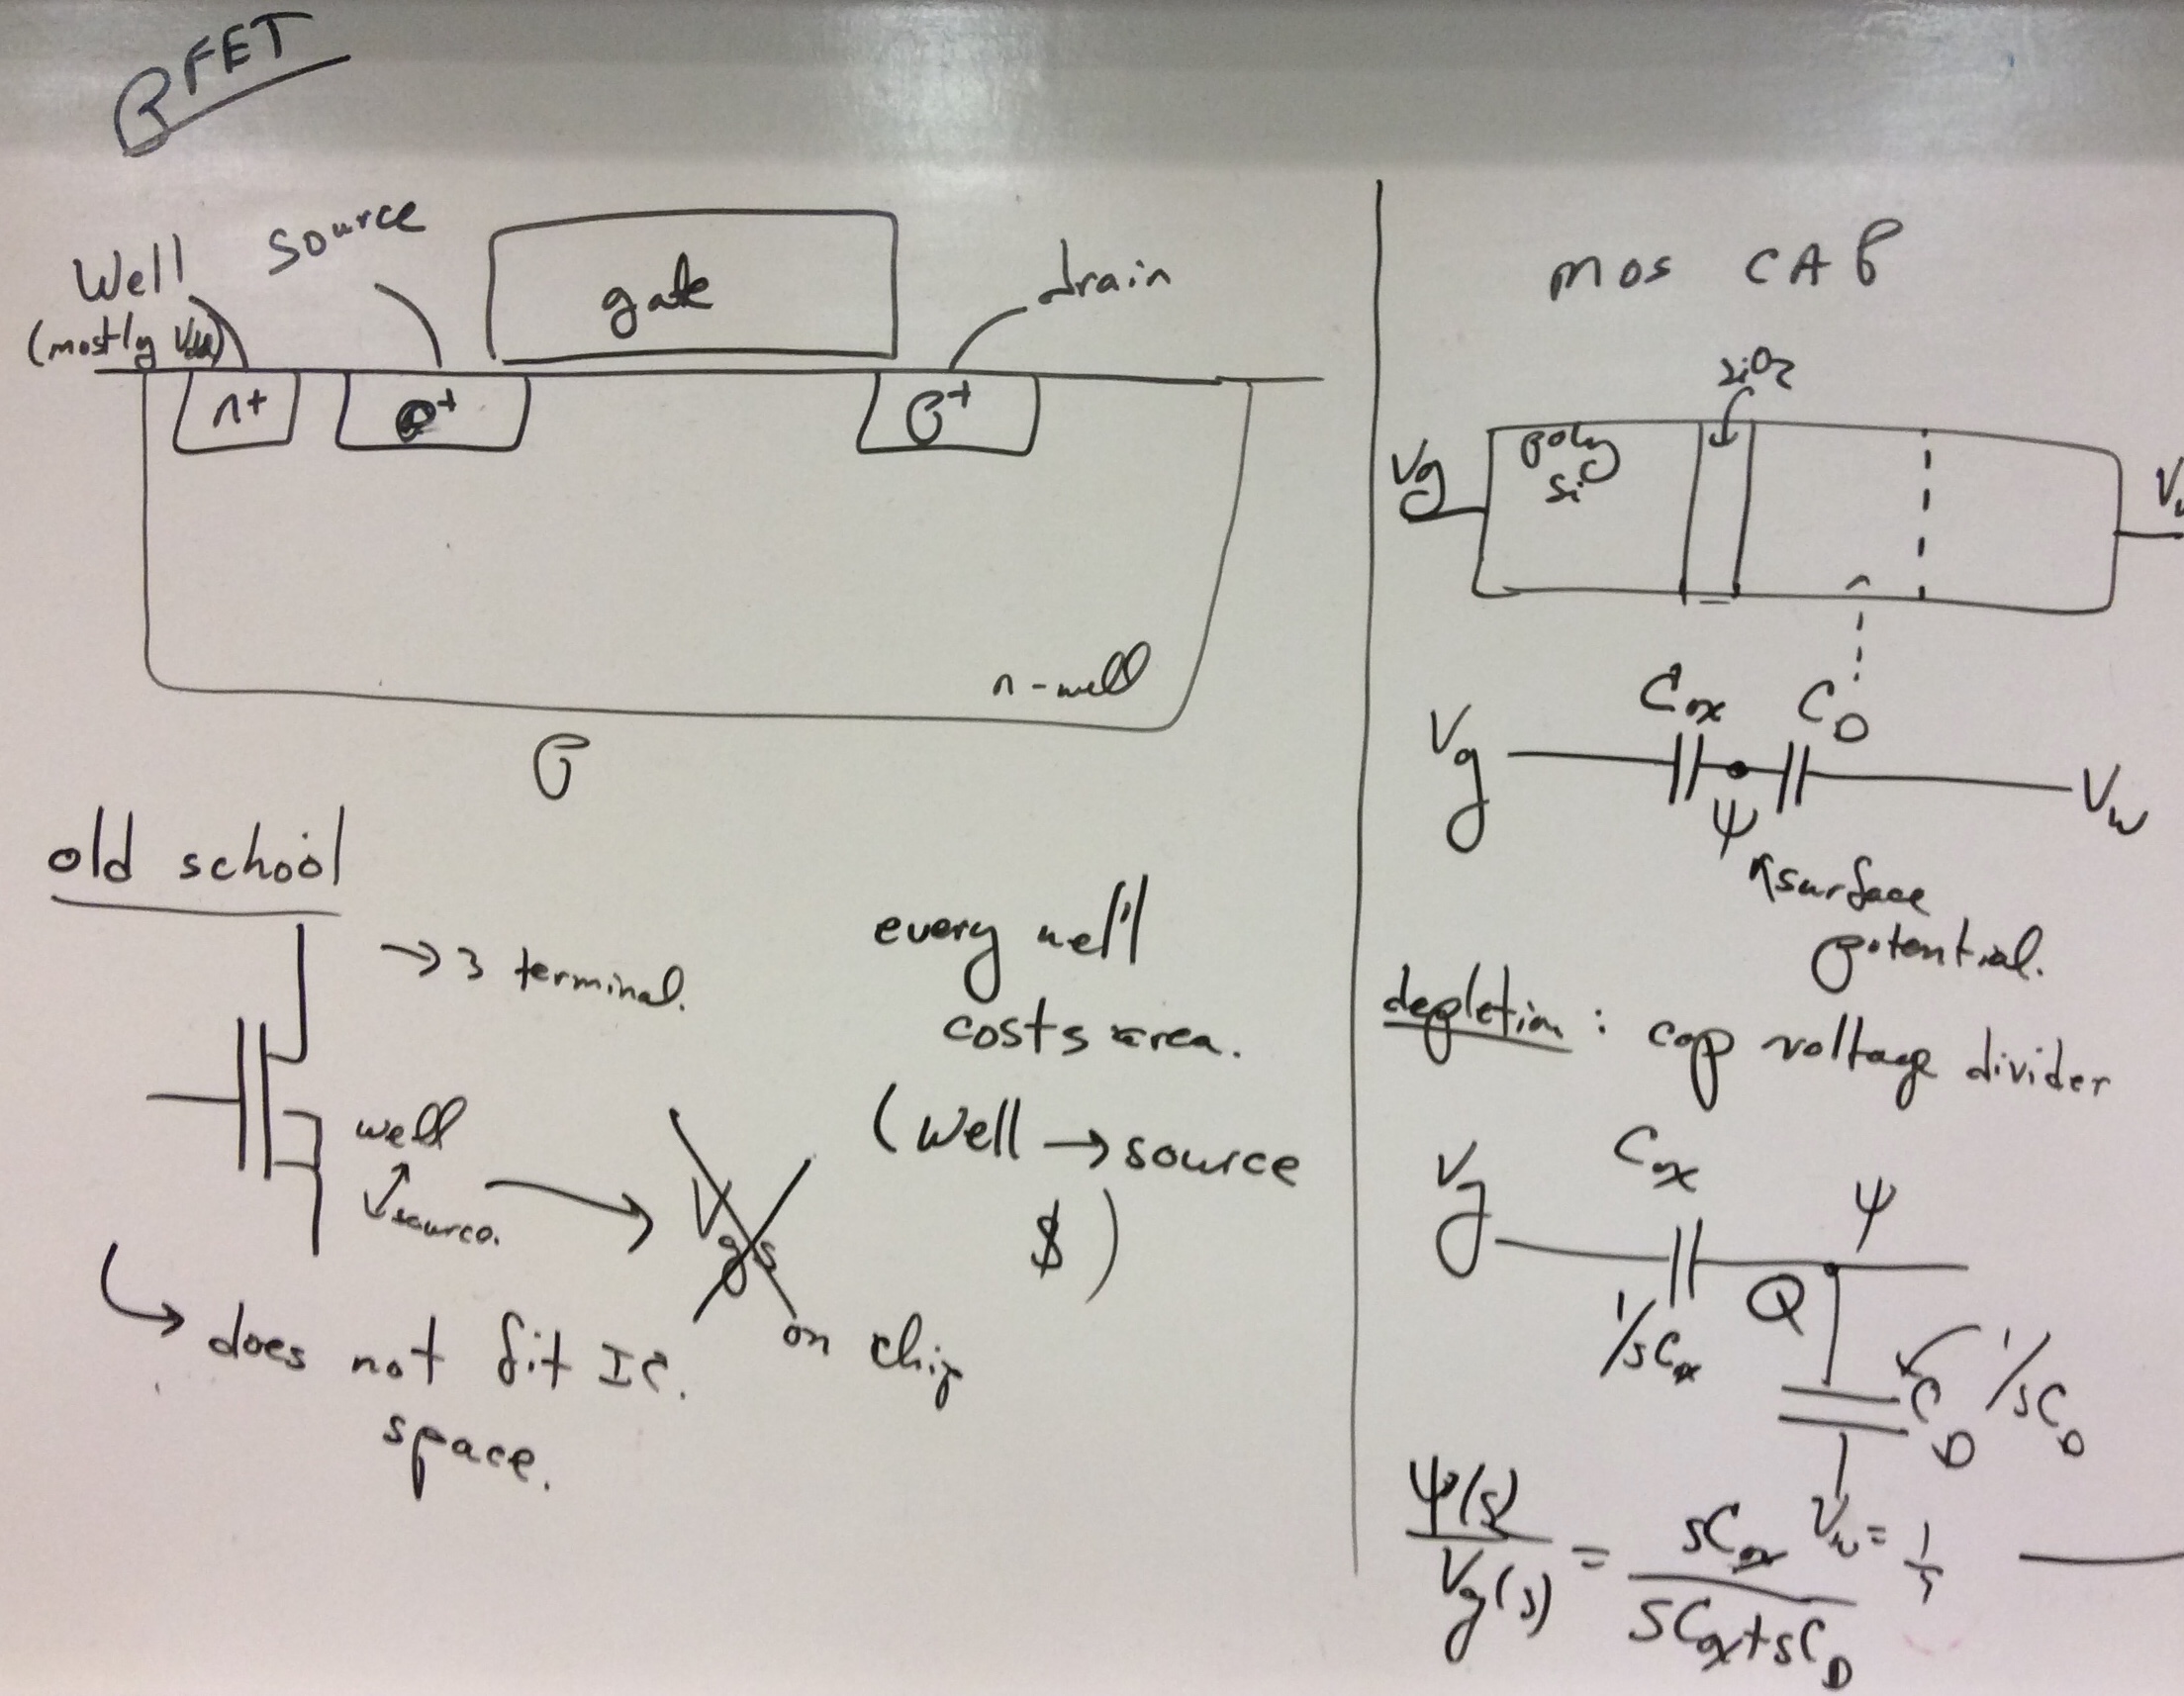
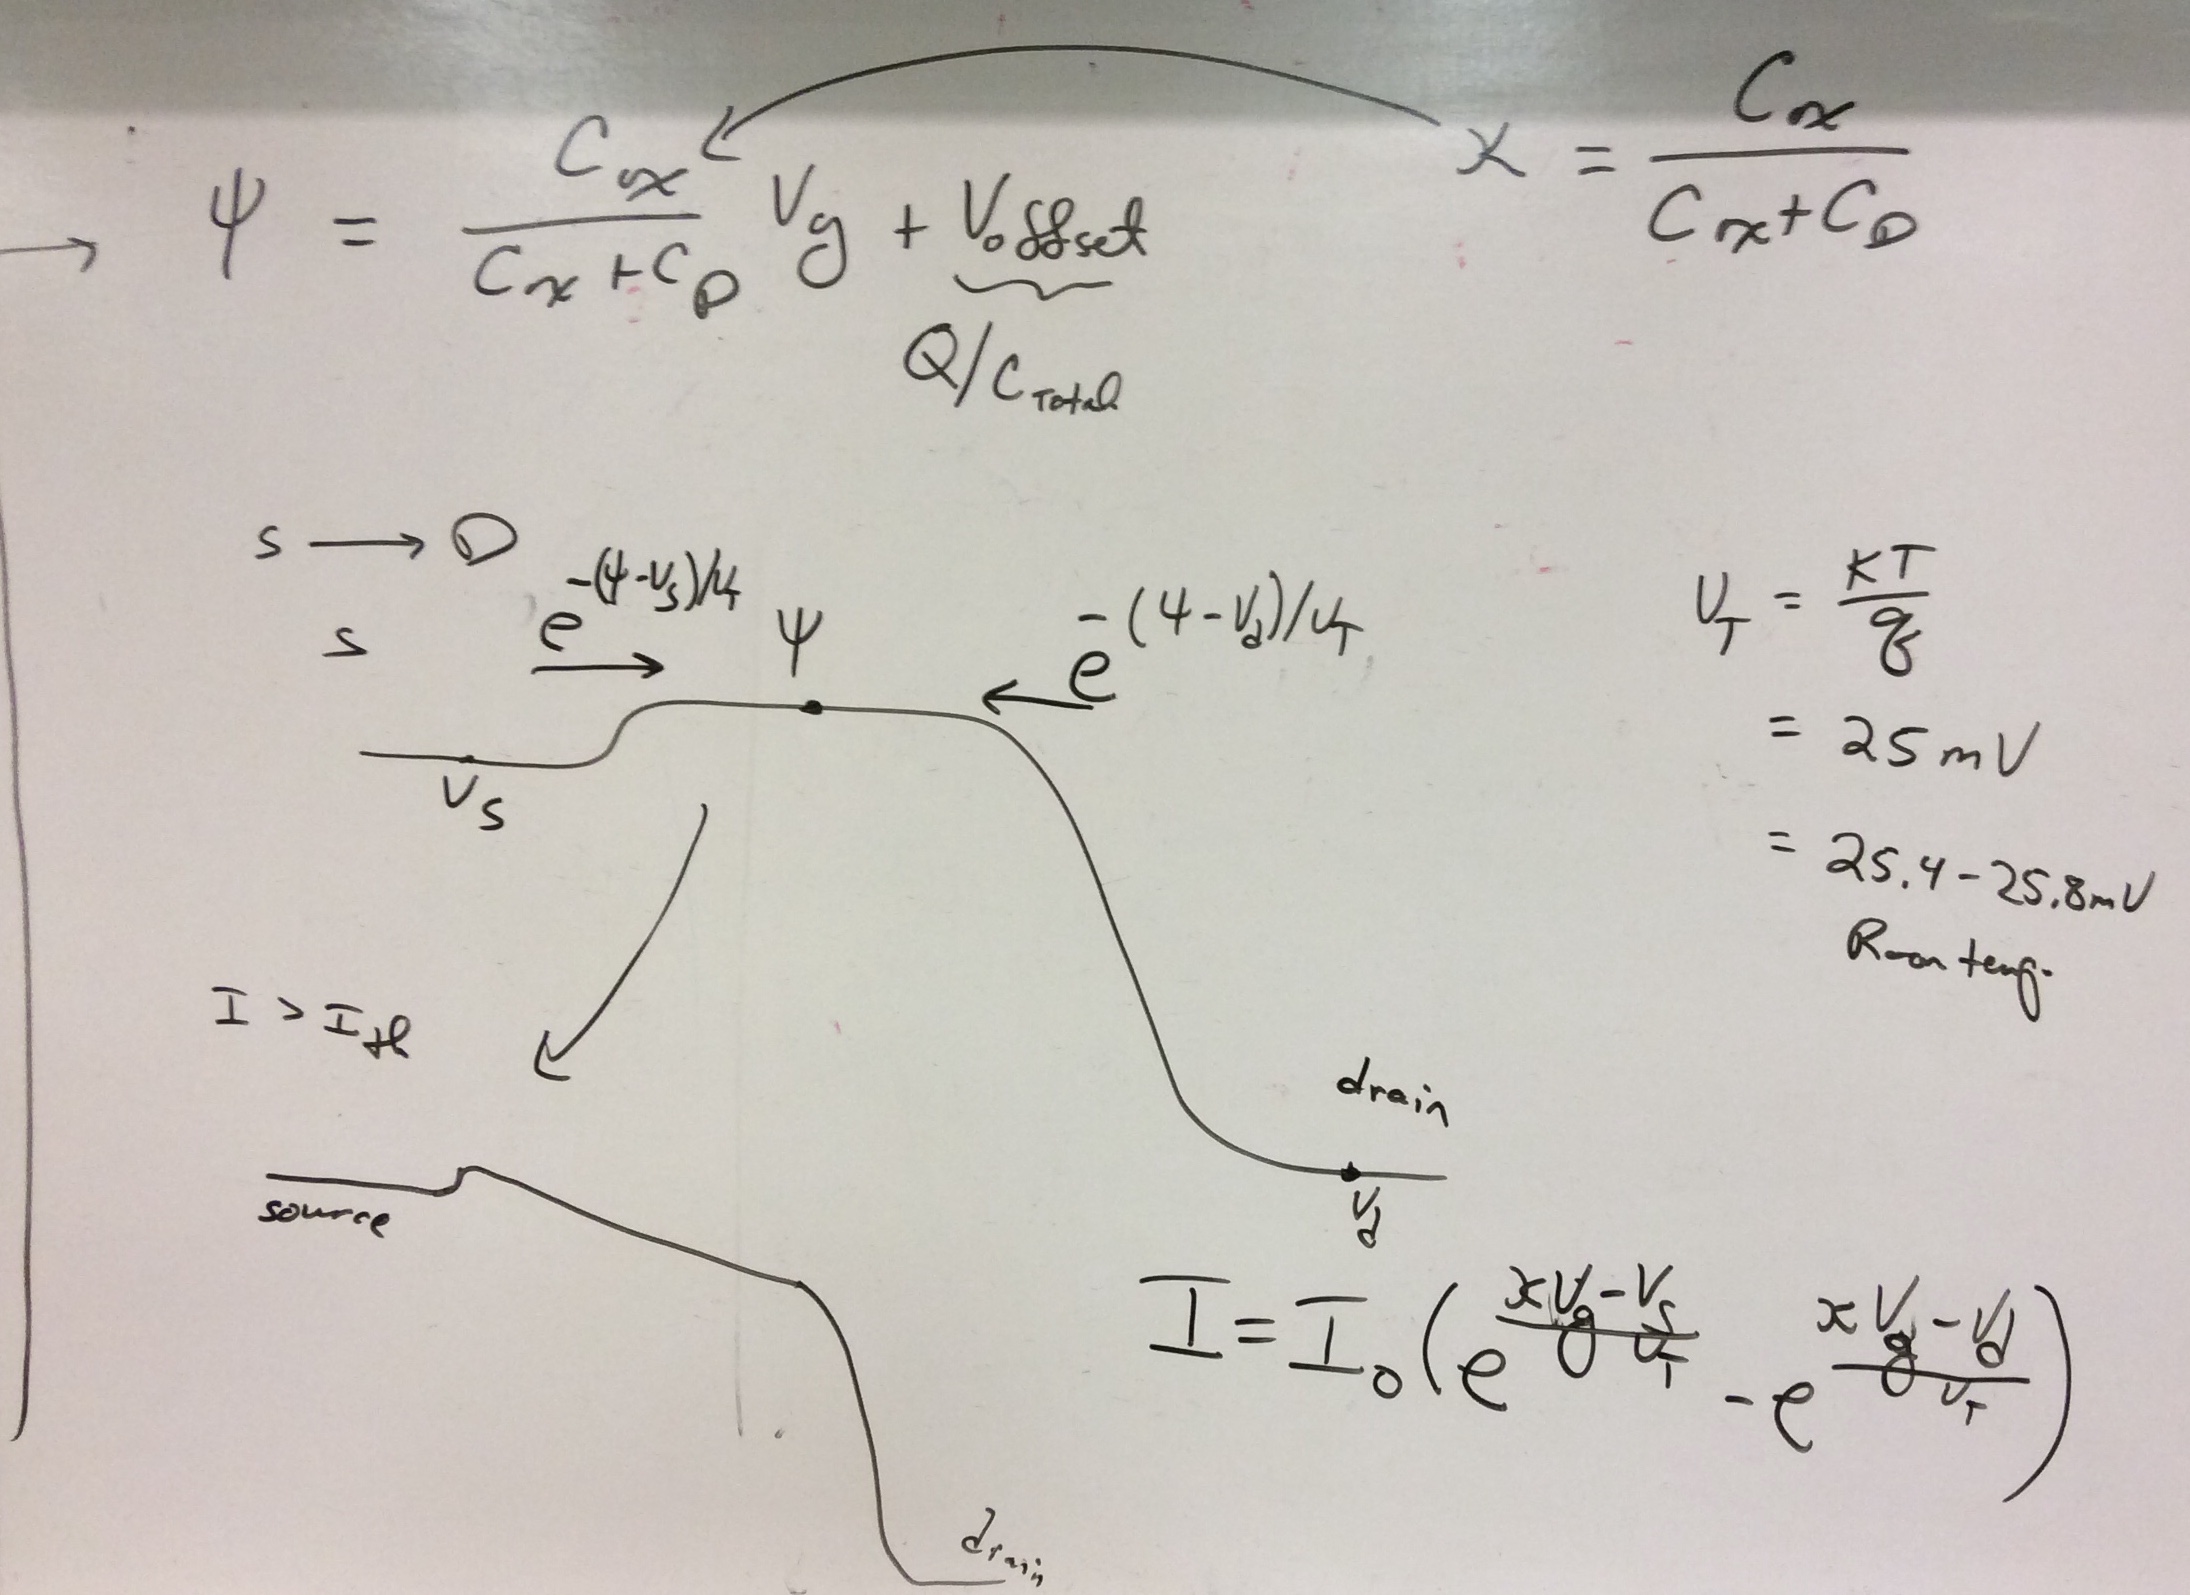
The gate terminal (Vg), couples into the surface potential,
the middle of the band diagram,
through a capacitive divider, where the attenuation is "kappa".
Therefore, Vg has a different coupling effect into the device than Vs,
and as a result, Vgs = Vg - Vs is never valid for bulk devices
except for the rare case when we can tie the substrate to the source.
- Primarily, Vgs is only valid for SOI type devices,
which brings a whole set of additional issues more suitable for another course on MOSFET devices.
We won't be doing SOI in this course, unless there is a strong desire to do it.
- The origin of the Vgs term goes back to discrete devices,
where three terminals was easier to handle than four terminals.
These approaches were trying to translate existing approaches
used for older BJT transistors and vacuum tubes for these "new" devices.
For modern (i.e. anything in the last 30 years) devices, one can not make these assumptions,
unless the designer pays additional cost and design time.
Therefore, although most textbooks have a lazy view of IC design, it is better from the beginning to understand things correctly.
These understandings will make circuit analysis easier in the long run.
- Therefore, don't use Vgs in this course.
Assume you will always be marked wrong if you take this approach. You have been warned.
Reading Material
- Documentation on setting up your system FPAA
- Chapter 2 Material : Basics of Device Physics
- Chapter 3 Material : Subthreshold Transistor Physics
- Classic paper on DIBL and "sigma"
(channel length modulation effect)
- T-square paper on Scilab / Xcos Transistor Modeling
(protected resource)
-
Summary Slides used for describing MOSFET Physics.
Much of the material appears in the taped lecture material.
- Basic MOSFET characteristics:
Subthreshold and Above Threshold
- Another outside resource from
Reid Harrison
on
Subthreshold MOSFET
physics used for his class at University of Utah.
These discussions are very close to our approach in class; I'm thankful he made this available on-line before
he left to start his successful neural probe startup company,
Intan Technologies
I would strongly recommend these materials to be used as source of additional information on MOSFET behavior.
He also had a set of notes on
MOSFETs
that include more physics as well as some above threshold behavior,
though there are some errors (i.e. use of Vgs) on the above threshold part of the design.
He also has a nice document on doing curve
fits
in MATLAB.
FPAA Reading Material
You might find these papers useful, since they describe the IC,
the tools, and the remote testing infrastructure.
-
large-scale Field Programmable Analog Arrays (FPAA).
First System on Chip (SoC) FPAA
Integrated Circuit
- FPAA design tools.
- FPAA Remote System.
Journal
Publications.
- Floating-gate programming.
SoC FPAA programming infrastructure
- Scaling
of Floating-Gate Devices (350nm to 40nm)
and Resulting FPAA architecture scaling.
Class Lecture Boards
- Lecture 1 boards
1 ,
2 ,
3 ,
4 ,
- Lecture 2 boards
1 ,
2 ,
3 ,
4 ,
- Lecture 3 boards
1 ,
2 ,
3 ,
4 ,
- Lecture 4 boards (Above VT MOSFET)
1 ,
2 ,
3 ,
4 ,
5 ,
6 ,
- Lecture 5 boards (Above VT MOSFET regression)
1 ,
2 ,
3 ,
4 ,
Notes 1 ,
- Lecture 6 boards (Review for Proj1)
1 ,
2 ,
3 ,
4 ,
Notes 1 ,
Project Items: Characterizing MOSFET Devices
This section we will use static experimental measurements of
MOSFET channel current versus gate voltage, source voltage, and drain voltage,
both for nFET and pFET devices.
All of these devices are compiled from an FPAA device and are identified as specific transistors,
"golden" devices, if you will.
When we go through a calibration process,
each board measures one "golden" nFET and pFET device
for a source, gate, and drain sweep.
Making measurements of transistors requires more infrastructure for the current measurements;
if you want to watch measured data, those opportunities could be arranged
(at a time convienent to the instructors).
The goal is that if you have transistors characterized,
particularly on the board your group is using,
then you can always extract the actual current in a particular circuit.
Further, voltage measurements in this system are easier and faster than current measurements.
Initial FPAA setup Data
We want to start the class making sure everyone has a working setup / infrastructure using the
FPAA IC.
In your summary, you need to mention your
FPAA board setup results.
including a plot showing remote and in-class measurement results.
- Download the FPAA toolset from the site and get the resulting VM running on your laptop. You must have virtual box on your laptop,
including the service pack. Import the resulting Ubuntu (linux) VM.
- Run this VM. The password is "reverse". When you have loaded the resulting VM,
press the "CADSP" button on the left side,
wait abit for things to load, and you will have the FPAA toolset in front of you.
The command window should look a lot like MATLAB, and you should try some simple MATLAB like experiments (i.e. Making plots).
- The blue GUI will have the controls you will require.
If you have launched things correctly, it should be rather obvious
(Blue background, with gray-ish buttons).
-
We will want to look at least one test cases before you get into class.
The GUI block has a pulldown menu. I would recommend using a DAC -- ADC block.
These circuits will be available on the demo GUI block.
- As we have a remote test system, which just became operational since our last class.
You use exactly the same toolset as if you had a board,
but you email the file rather than programming a local board.
The results will be emailed back to your email.
Of course, we both have record of the email, and we have the right to ask which email was used.
- The remote system changed recently to make sending files easier without having email security issues.
The best approach we have is allowing one to send email using say a gmail account.
It will require you to input your account name and password, but that info is only used
to authenticate your email (POP) submission.
What you will do when you are in class:
- We will get every group of 2 working to do the same two experiments you did with the remote system.
- We will check to see the assignment (remote system, etc.) is done at the beginning of class
- You will need to connect a board through your laptop's USB port,
and make sure it is communicating into the VM.
- You will take the above circuit(s) and compile them to the FPAA board,
and will compare the resulting measurements.
Your group will need plots of these measurements,
and will compare the measurements with the remote system.
You need to have a grounding strap to use the equipment. Many of you might already have one. Yes, you would only need one per group, although each person in a group having one would be very helpful. These boards are unique, and although they look like industrial quality boards (and are close), they were developed here at GT, so you must take precautions. It is costly to replace, and I want to spare all of you of having to deal with that concern. Assume this is a requirement.
Getting your Data
Regressing the MOSFET I-V curves uses the chips (3.0) assigned to you in the pdf.
Since the remote systems use chip number 01 or 13, I would use those numbers for extracting your data.
The data for these I-V curves is read:
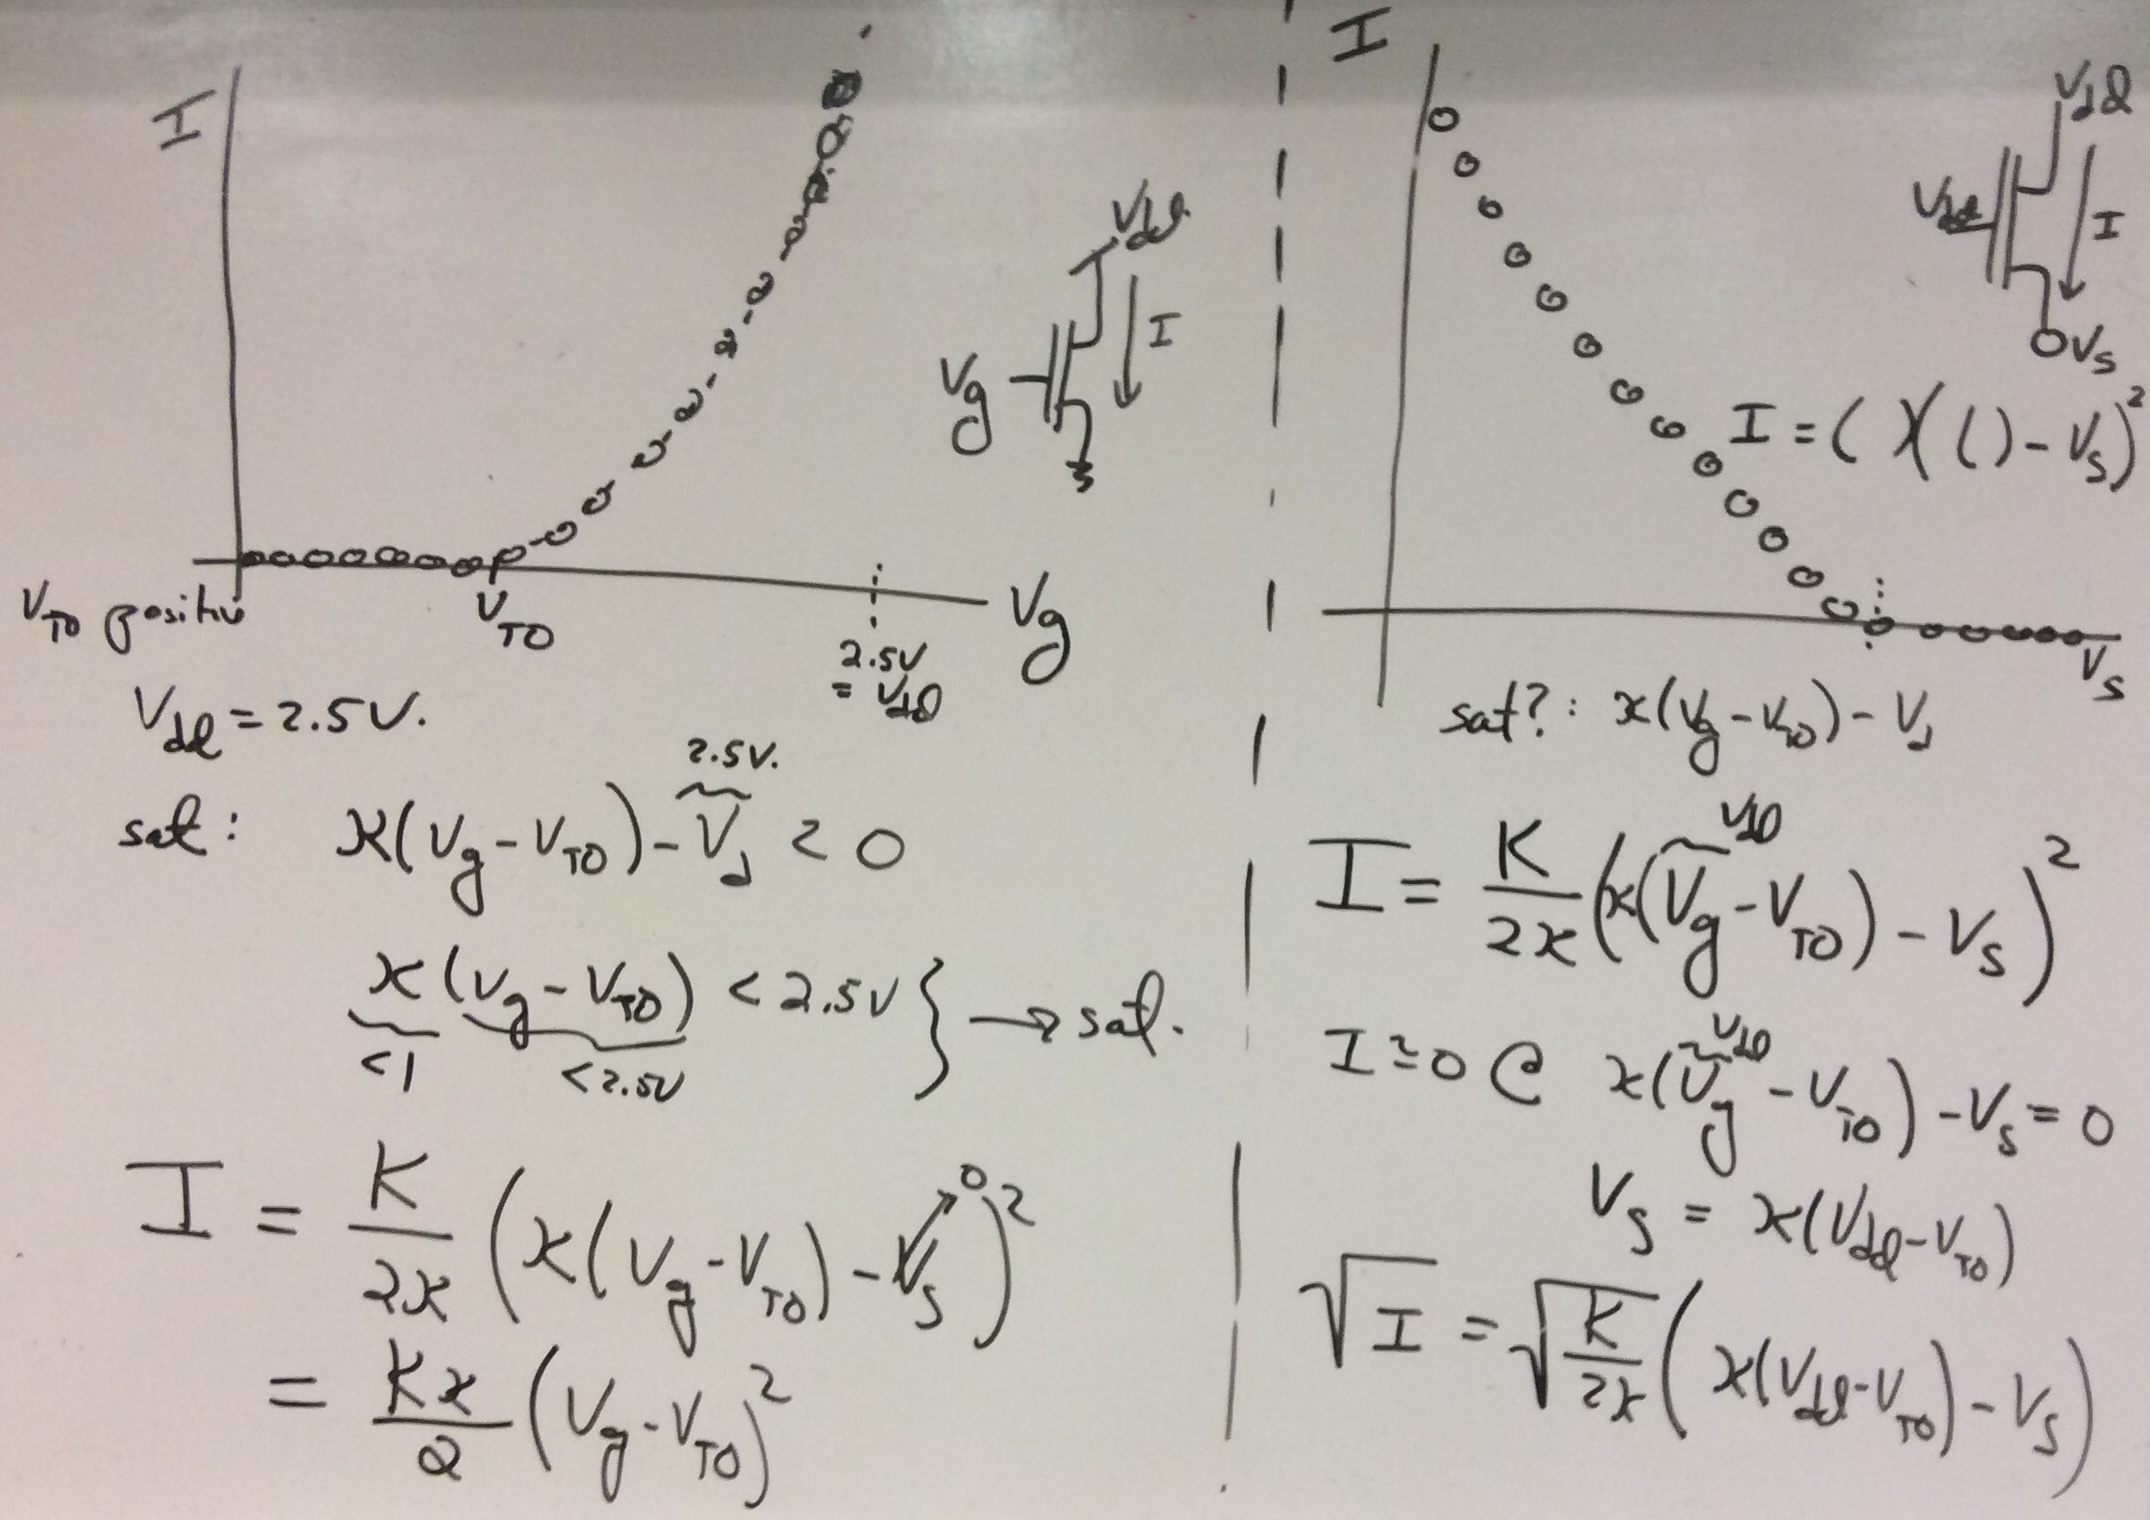
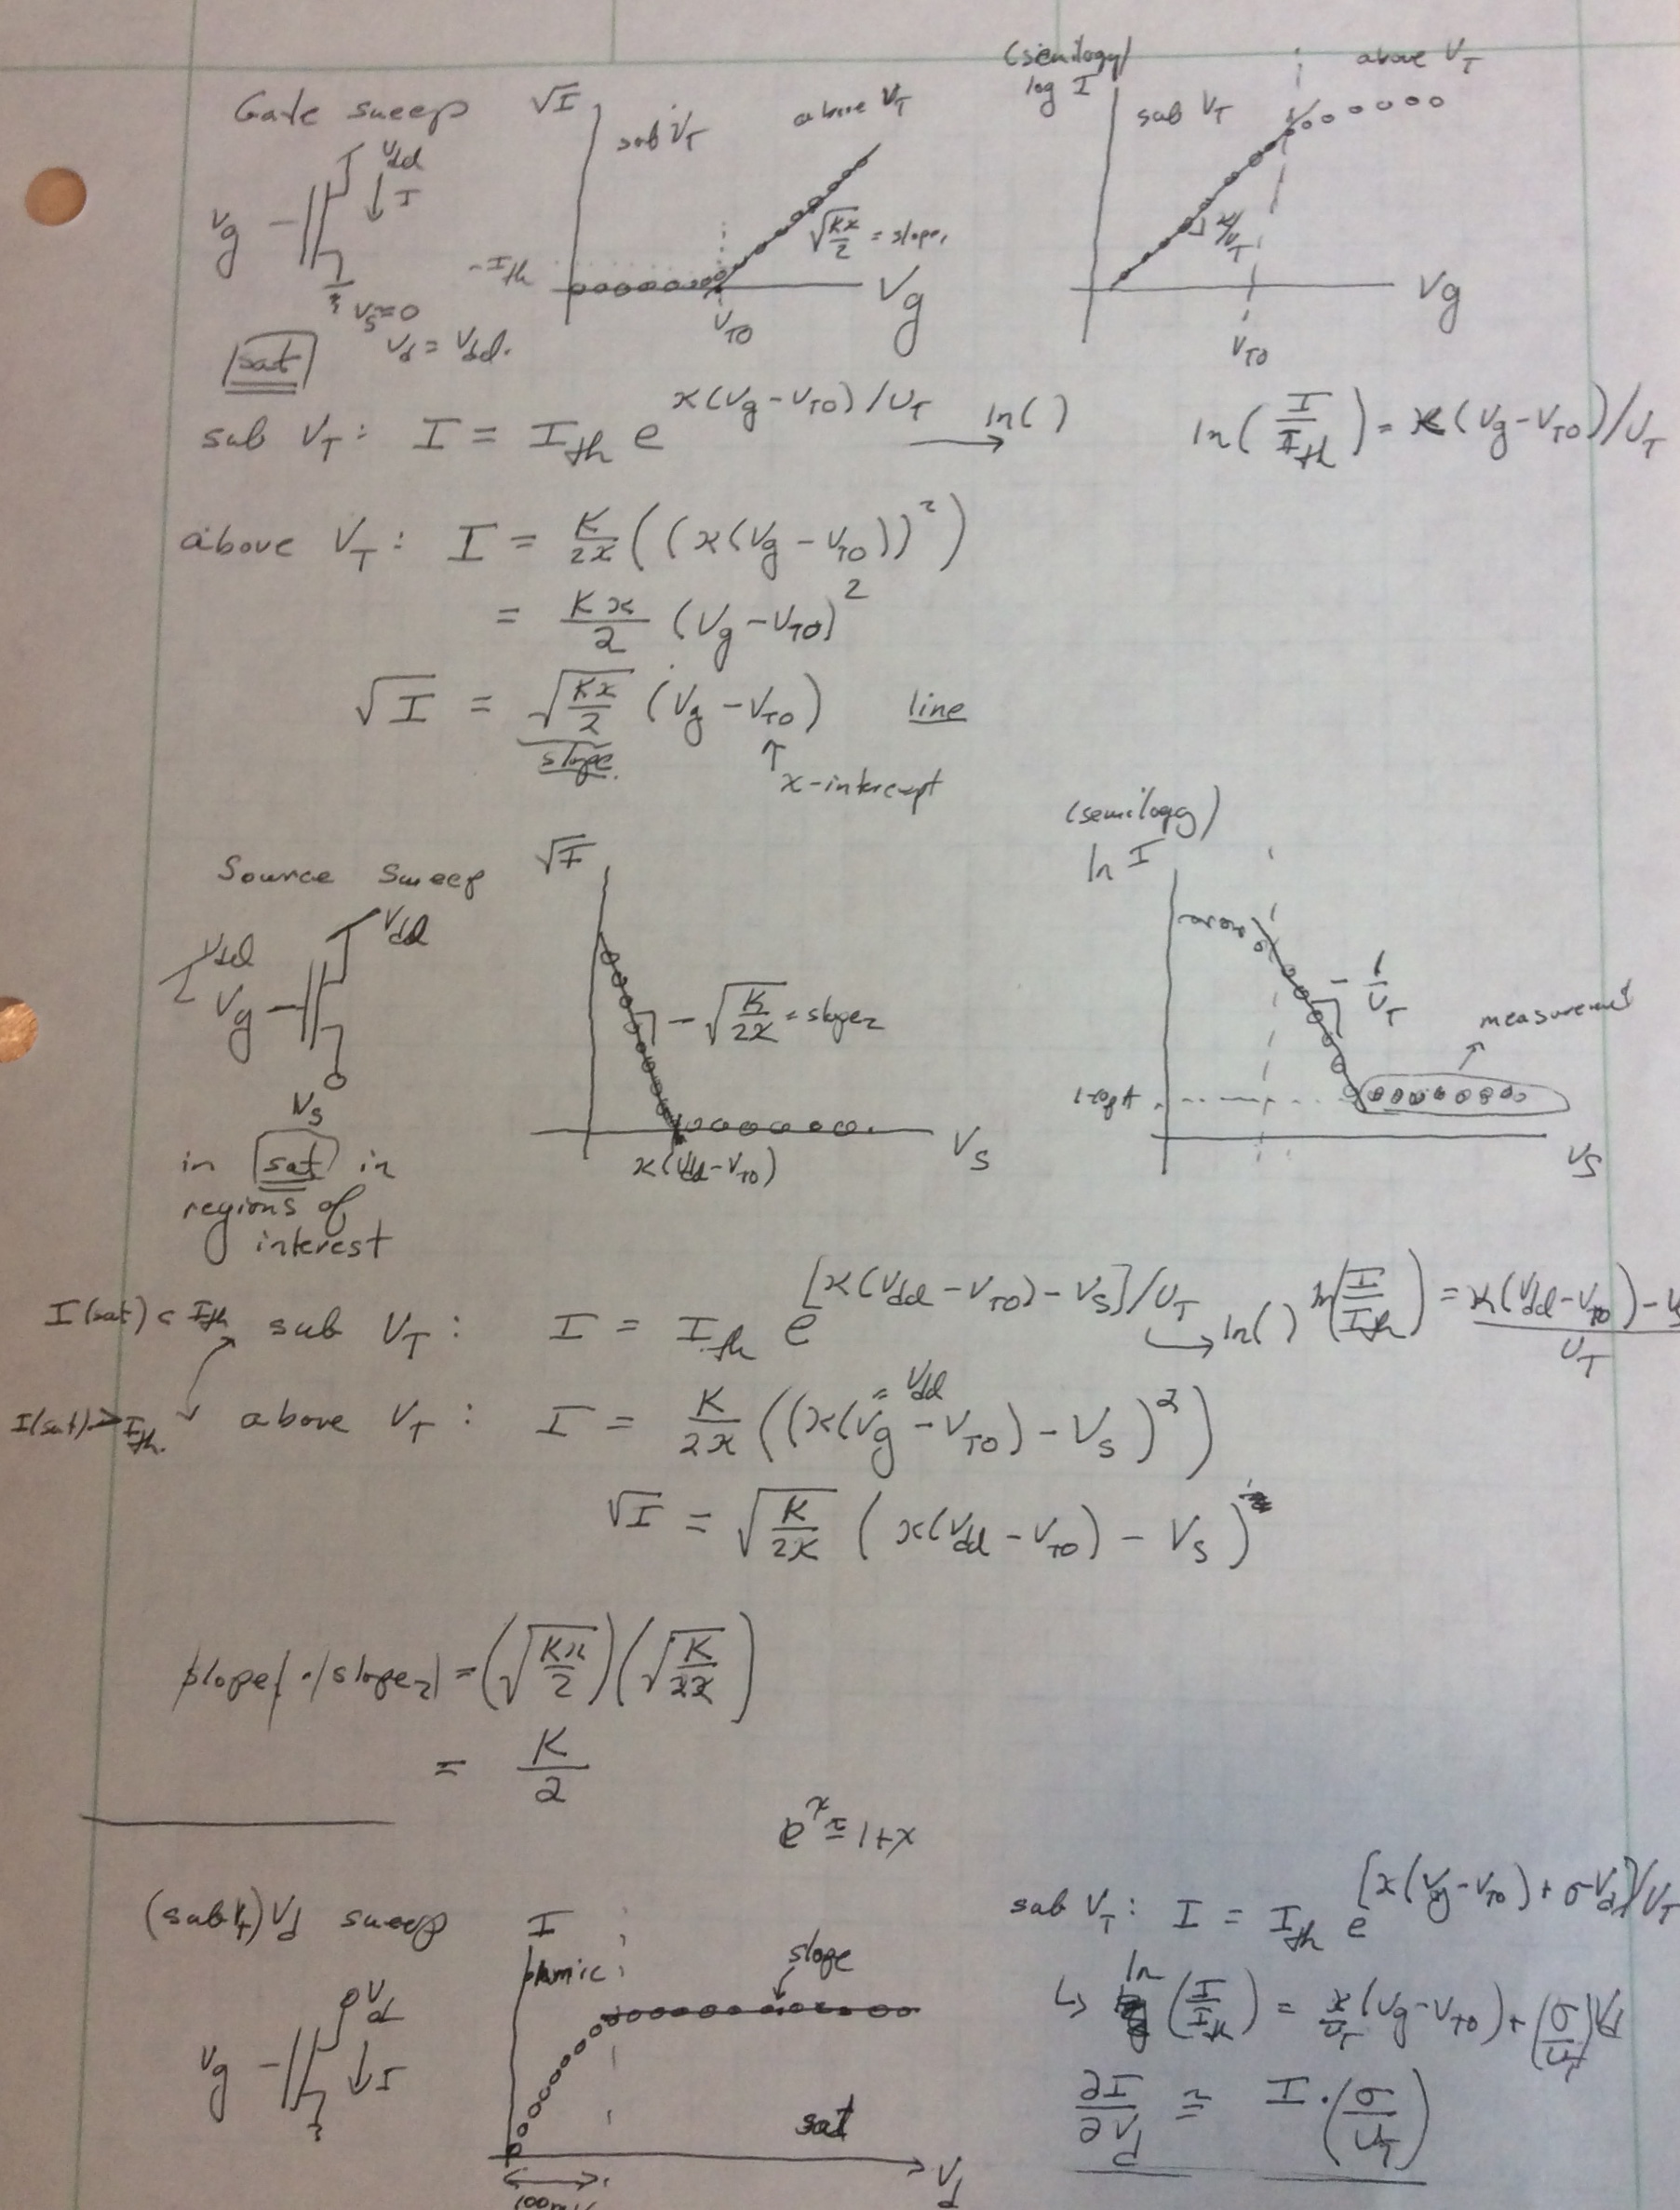
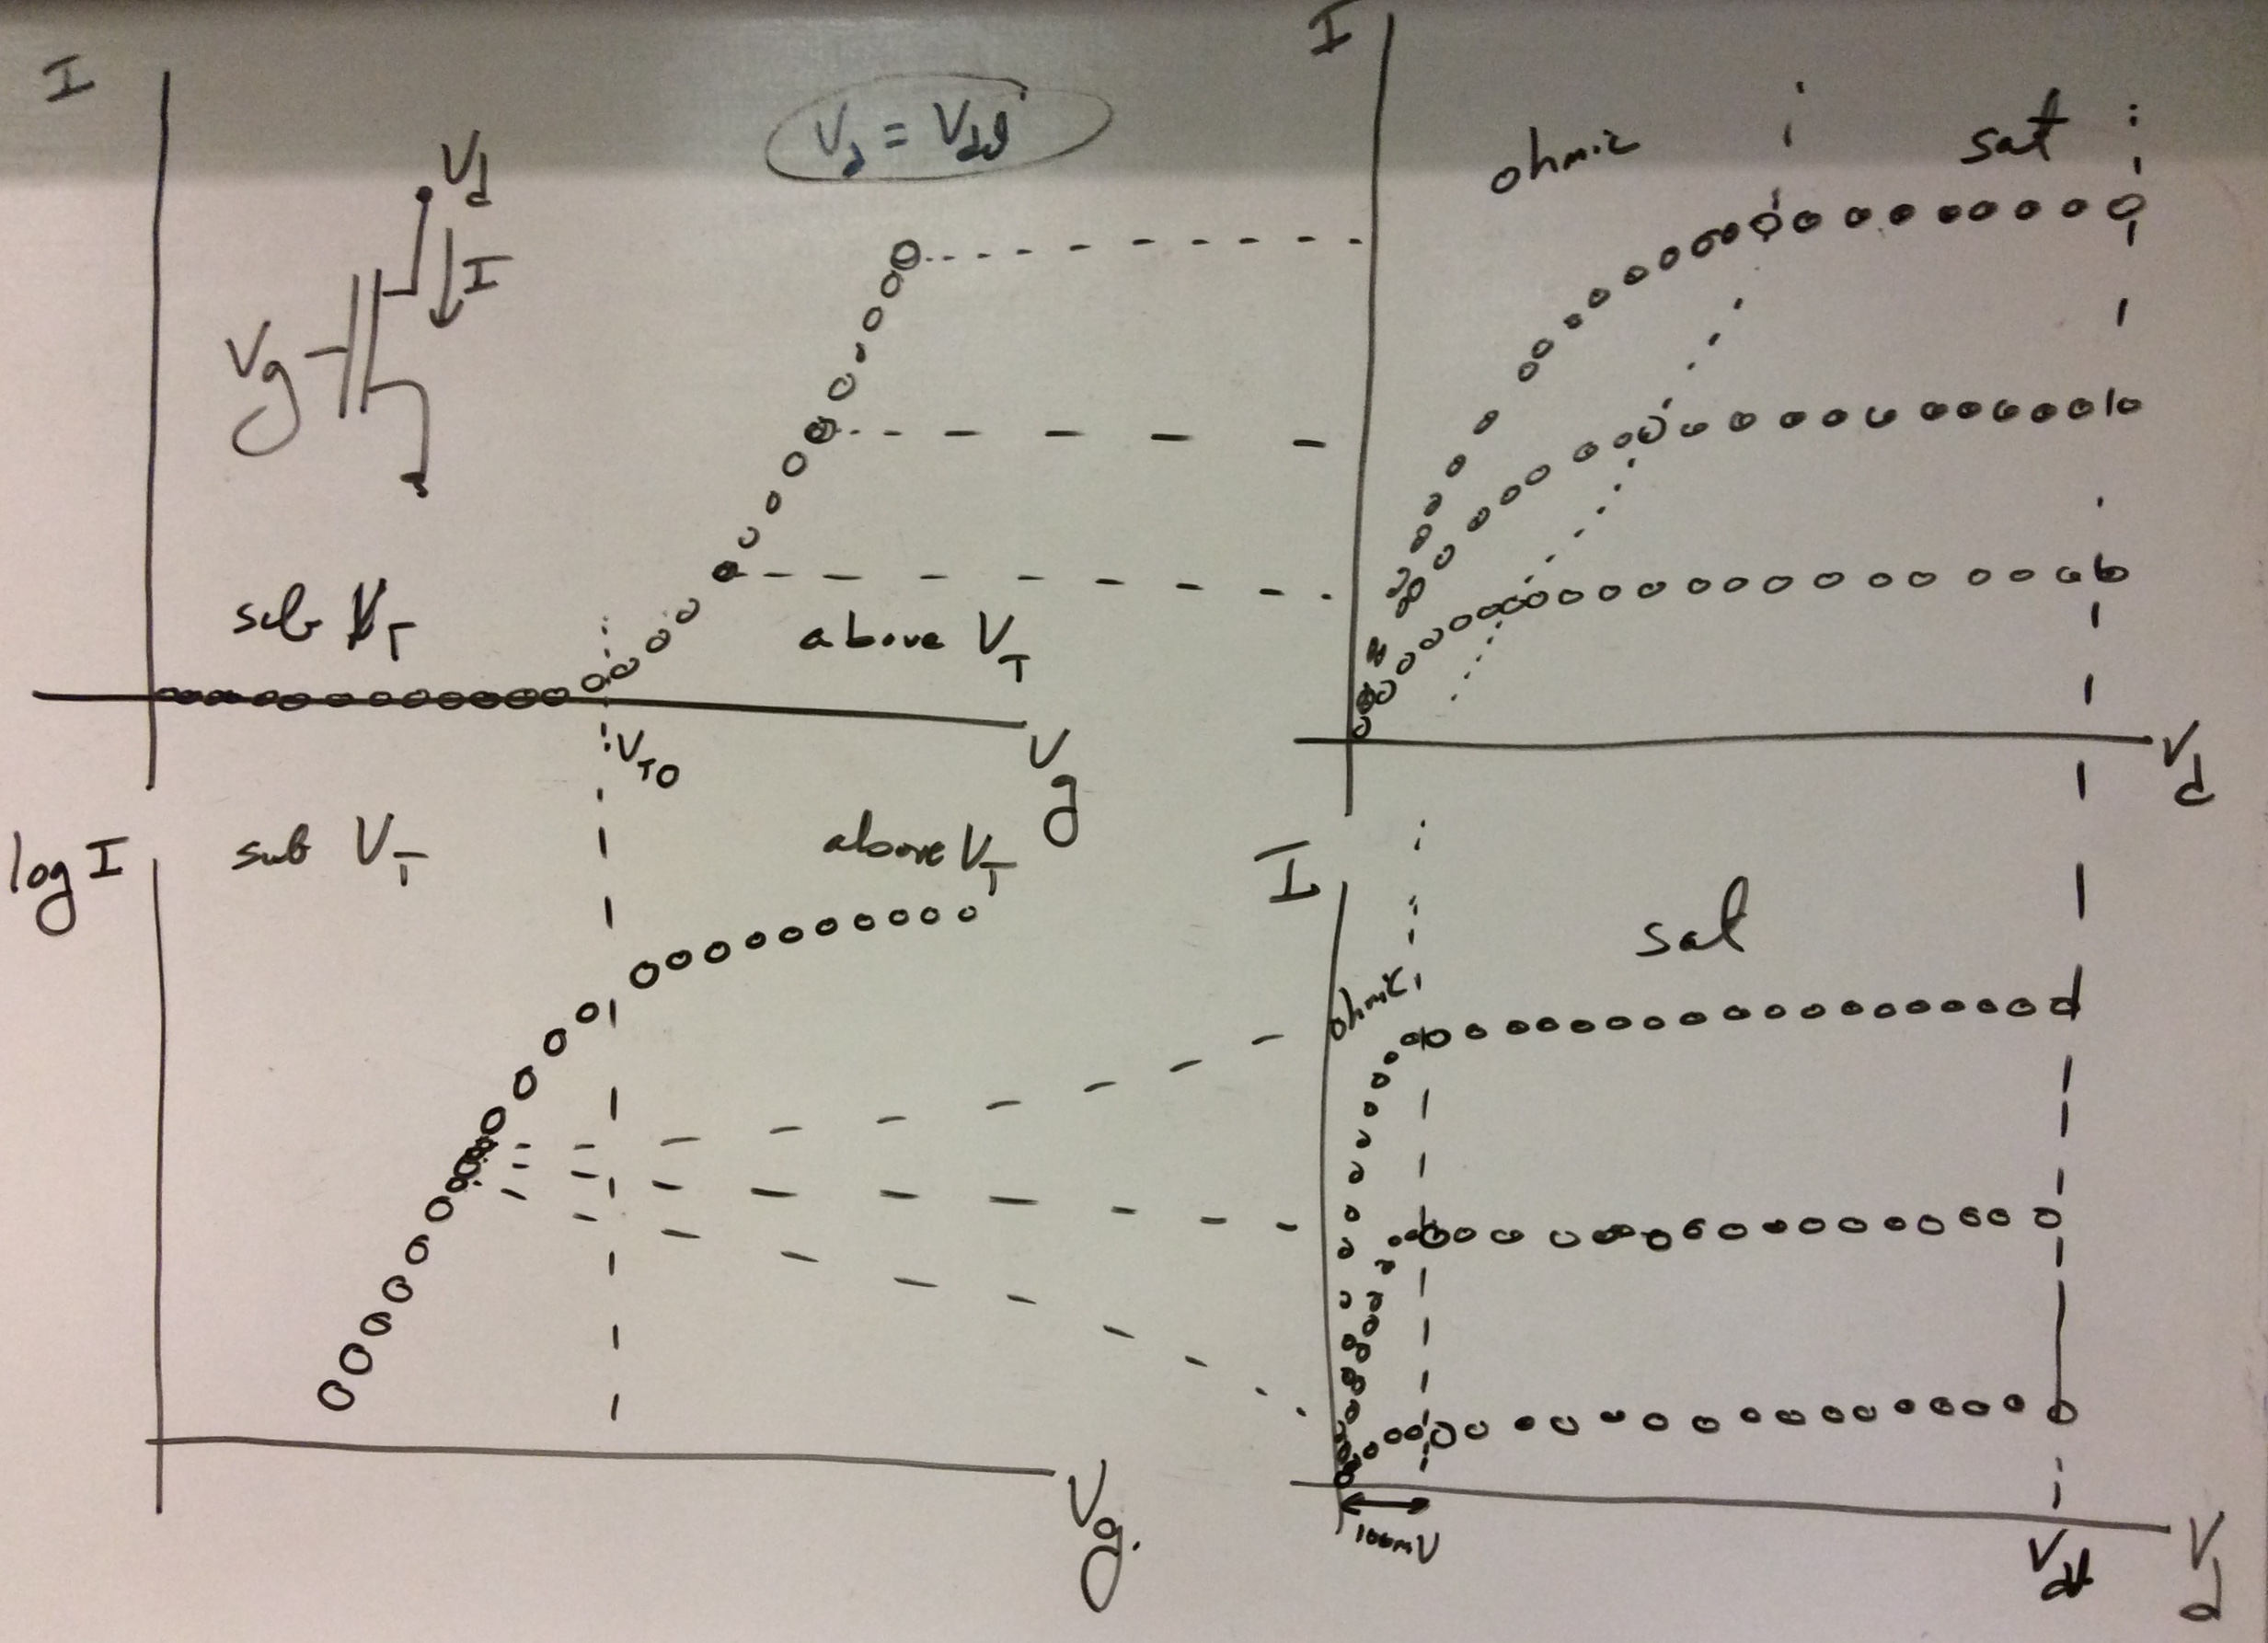
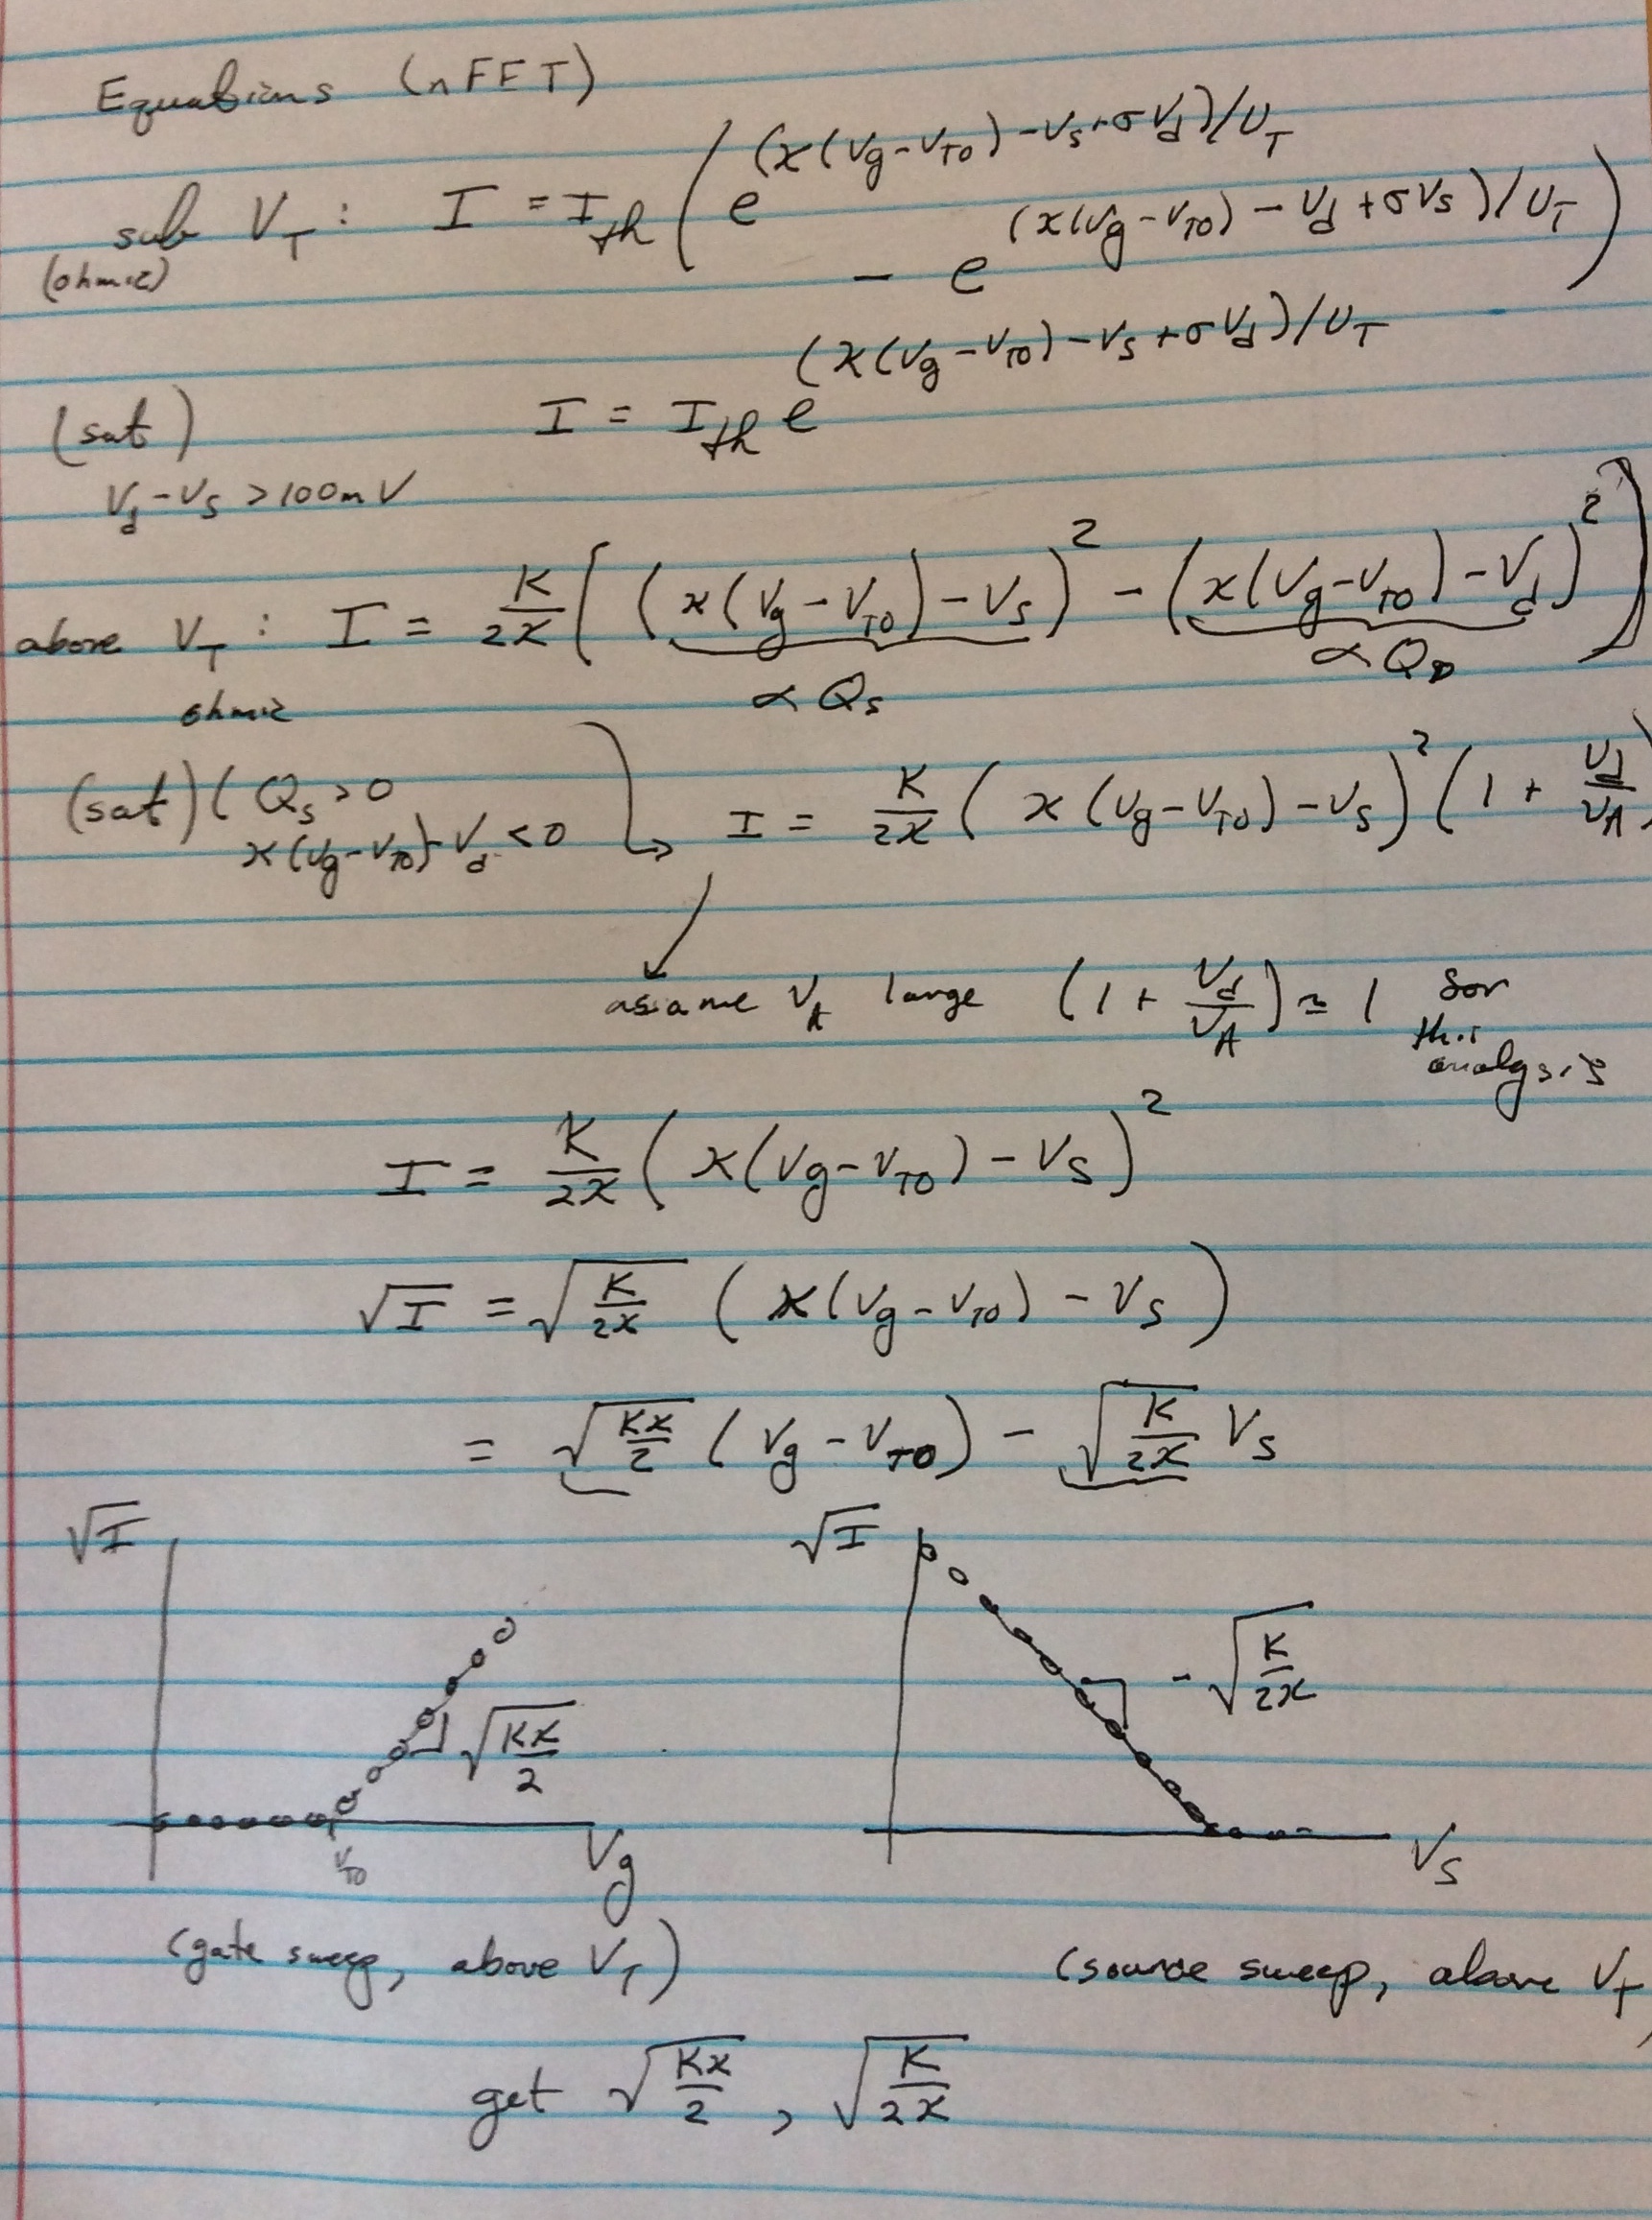
Gate voltage sweep
First we took a measurement of source current versus gate voltage swept for a device
with the source voltage held at GND / Vdd (nFET / pFET)
for the device operating in saturation throughout the sweep.
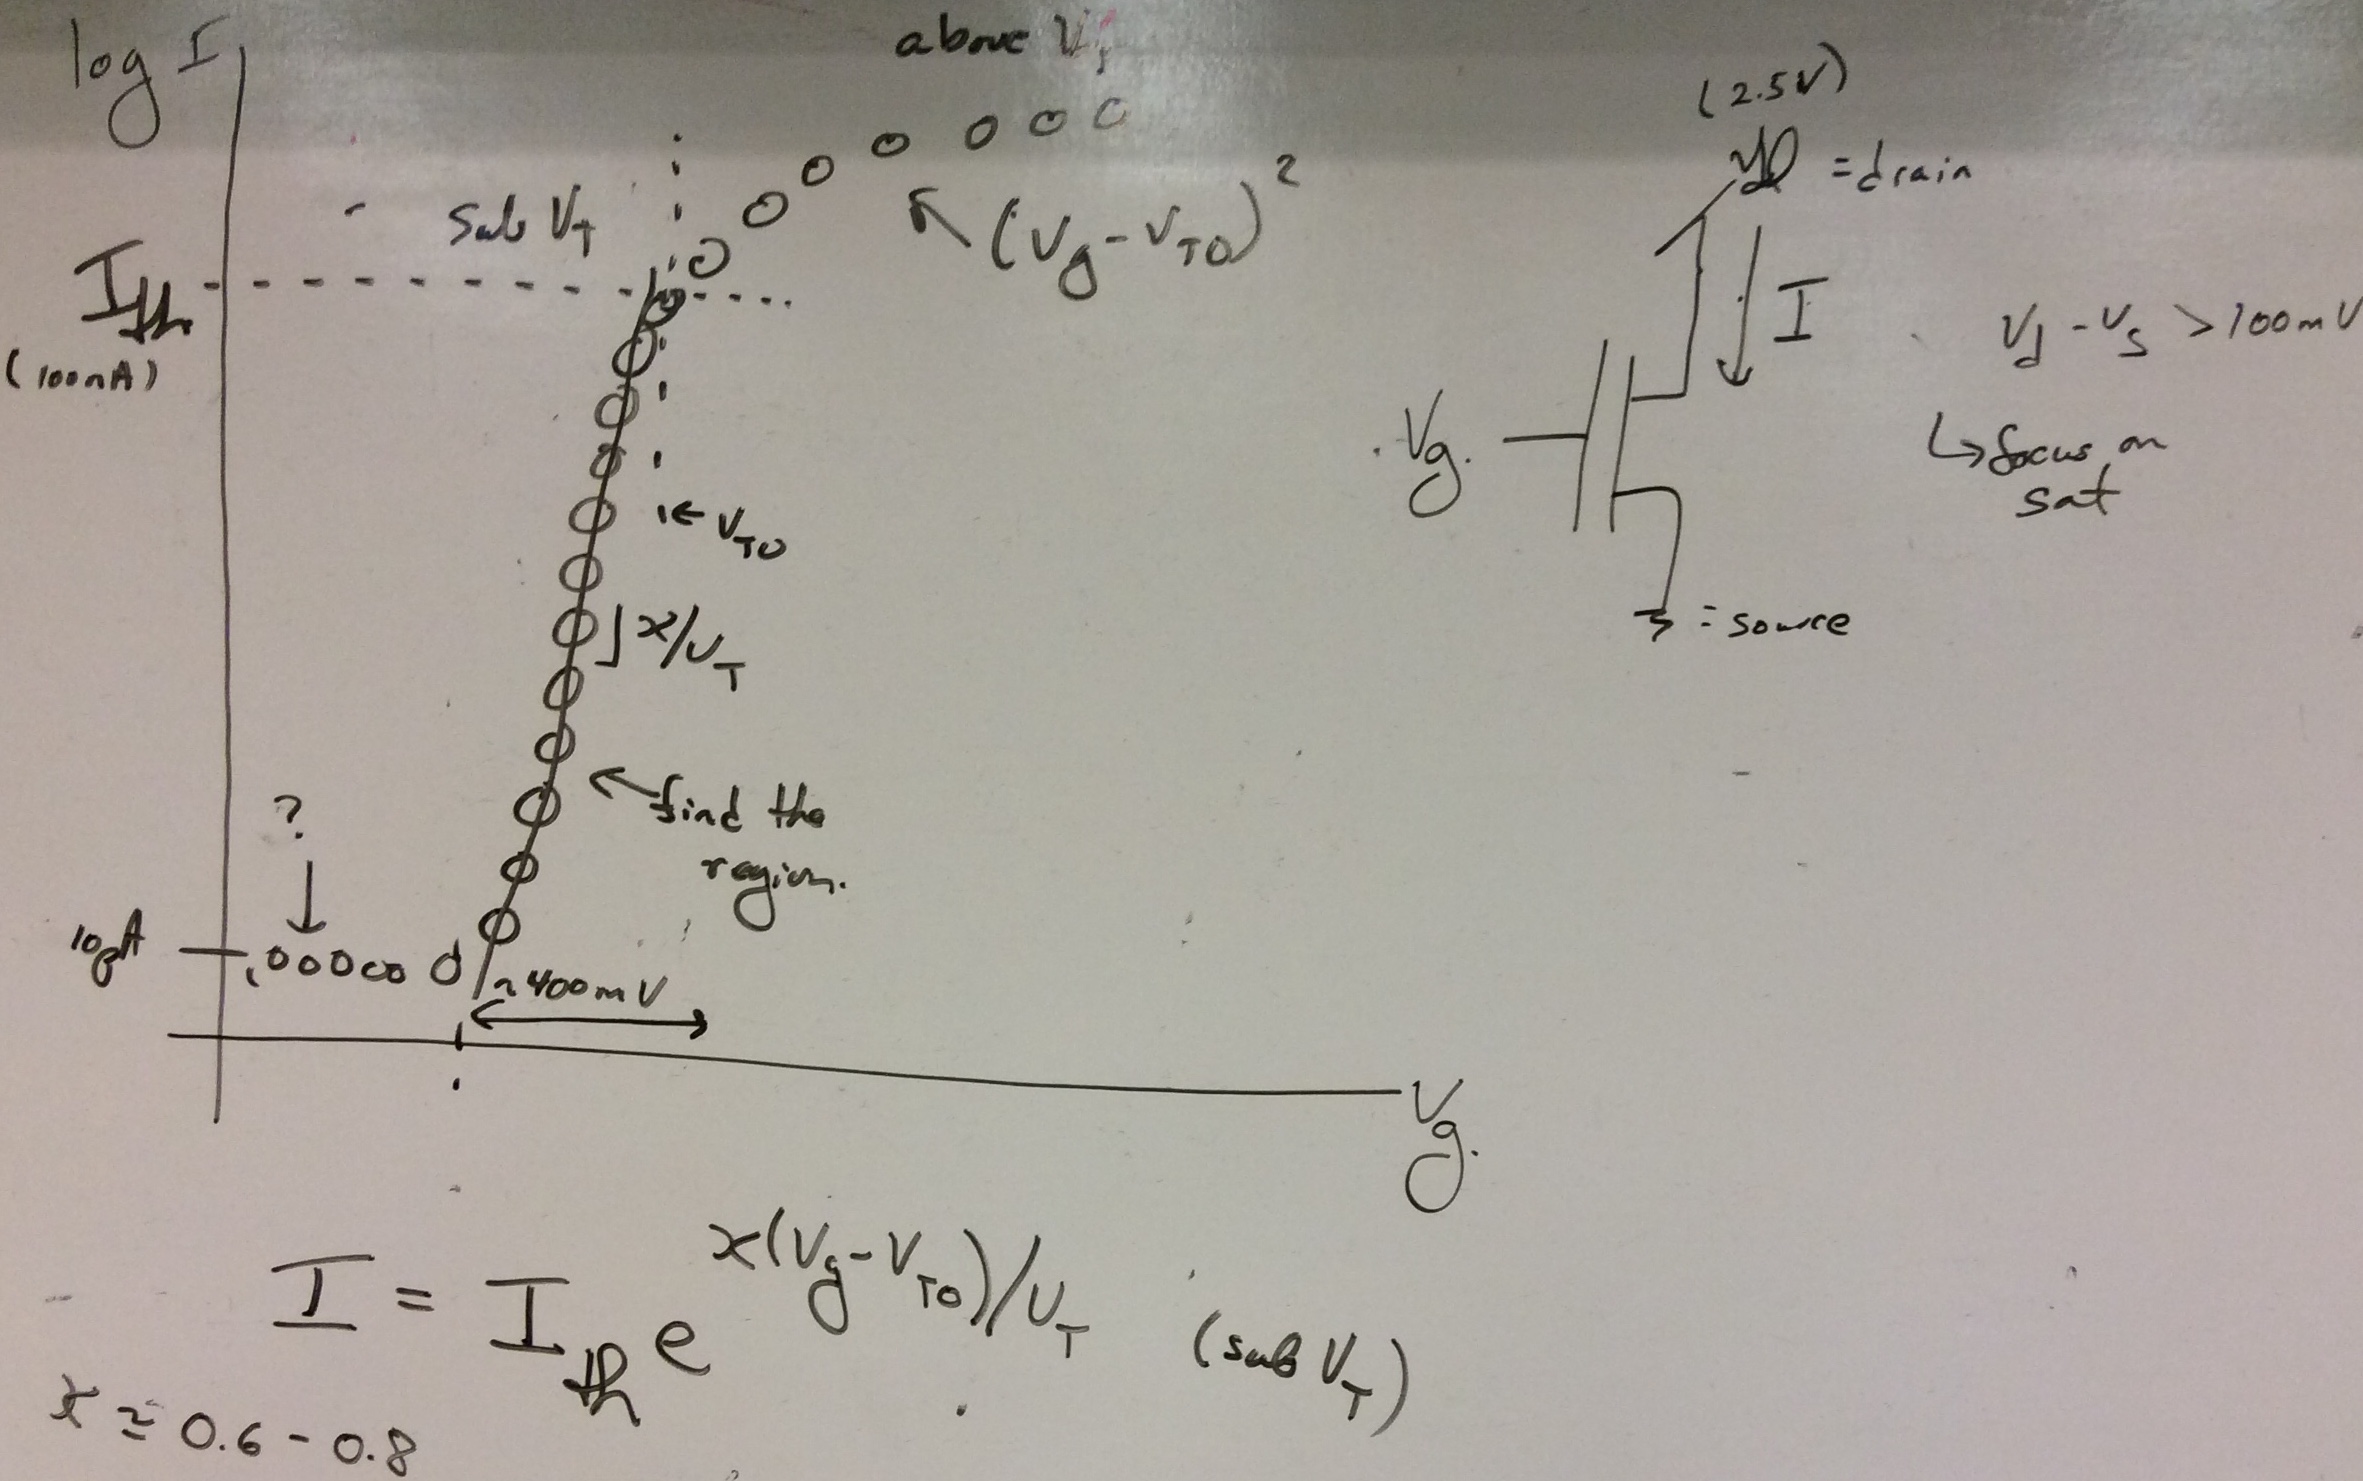
Focus your analysis so you get primarily the subthreshold region
and some points just outside near the subthreshold region.
You may do additional analysis for above threshold currents if you want.
Fit the theoretical expression in the subthreshold region of operation (an exponential curve fit).
Identify "kappa" and threshold voltage and Io. Identify any interesting / unexpected parts of the graph,
and explain where it comes from
(i.e. do not say it was "measurement error"... what type of measurement error, if that is the case).
You should include one figure for this experiment showing Ids versus Vg curve showing
subthreshold operation (exponential current).
In both plots you should show the experimental data, and the appropriate curve fit;
do not have separate plots where you can not compare the results and expect to get any credit.
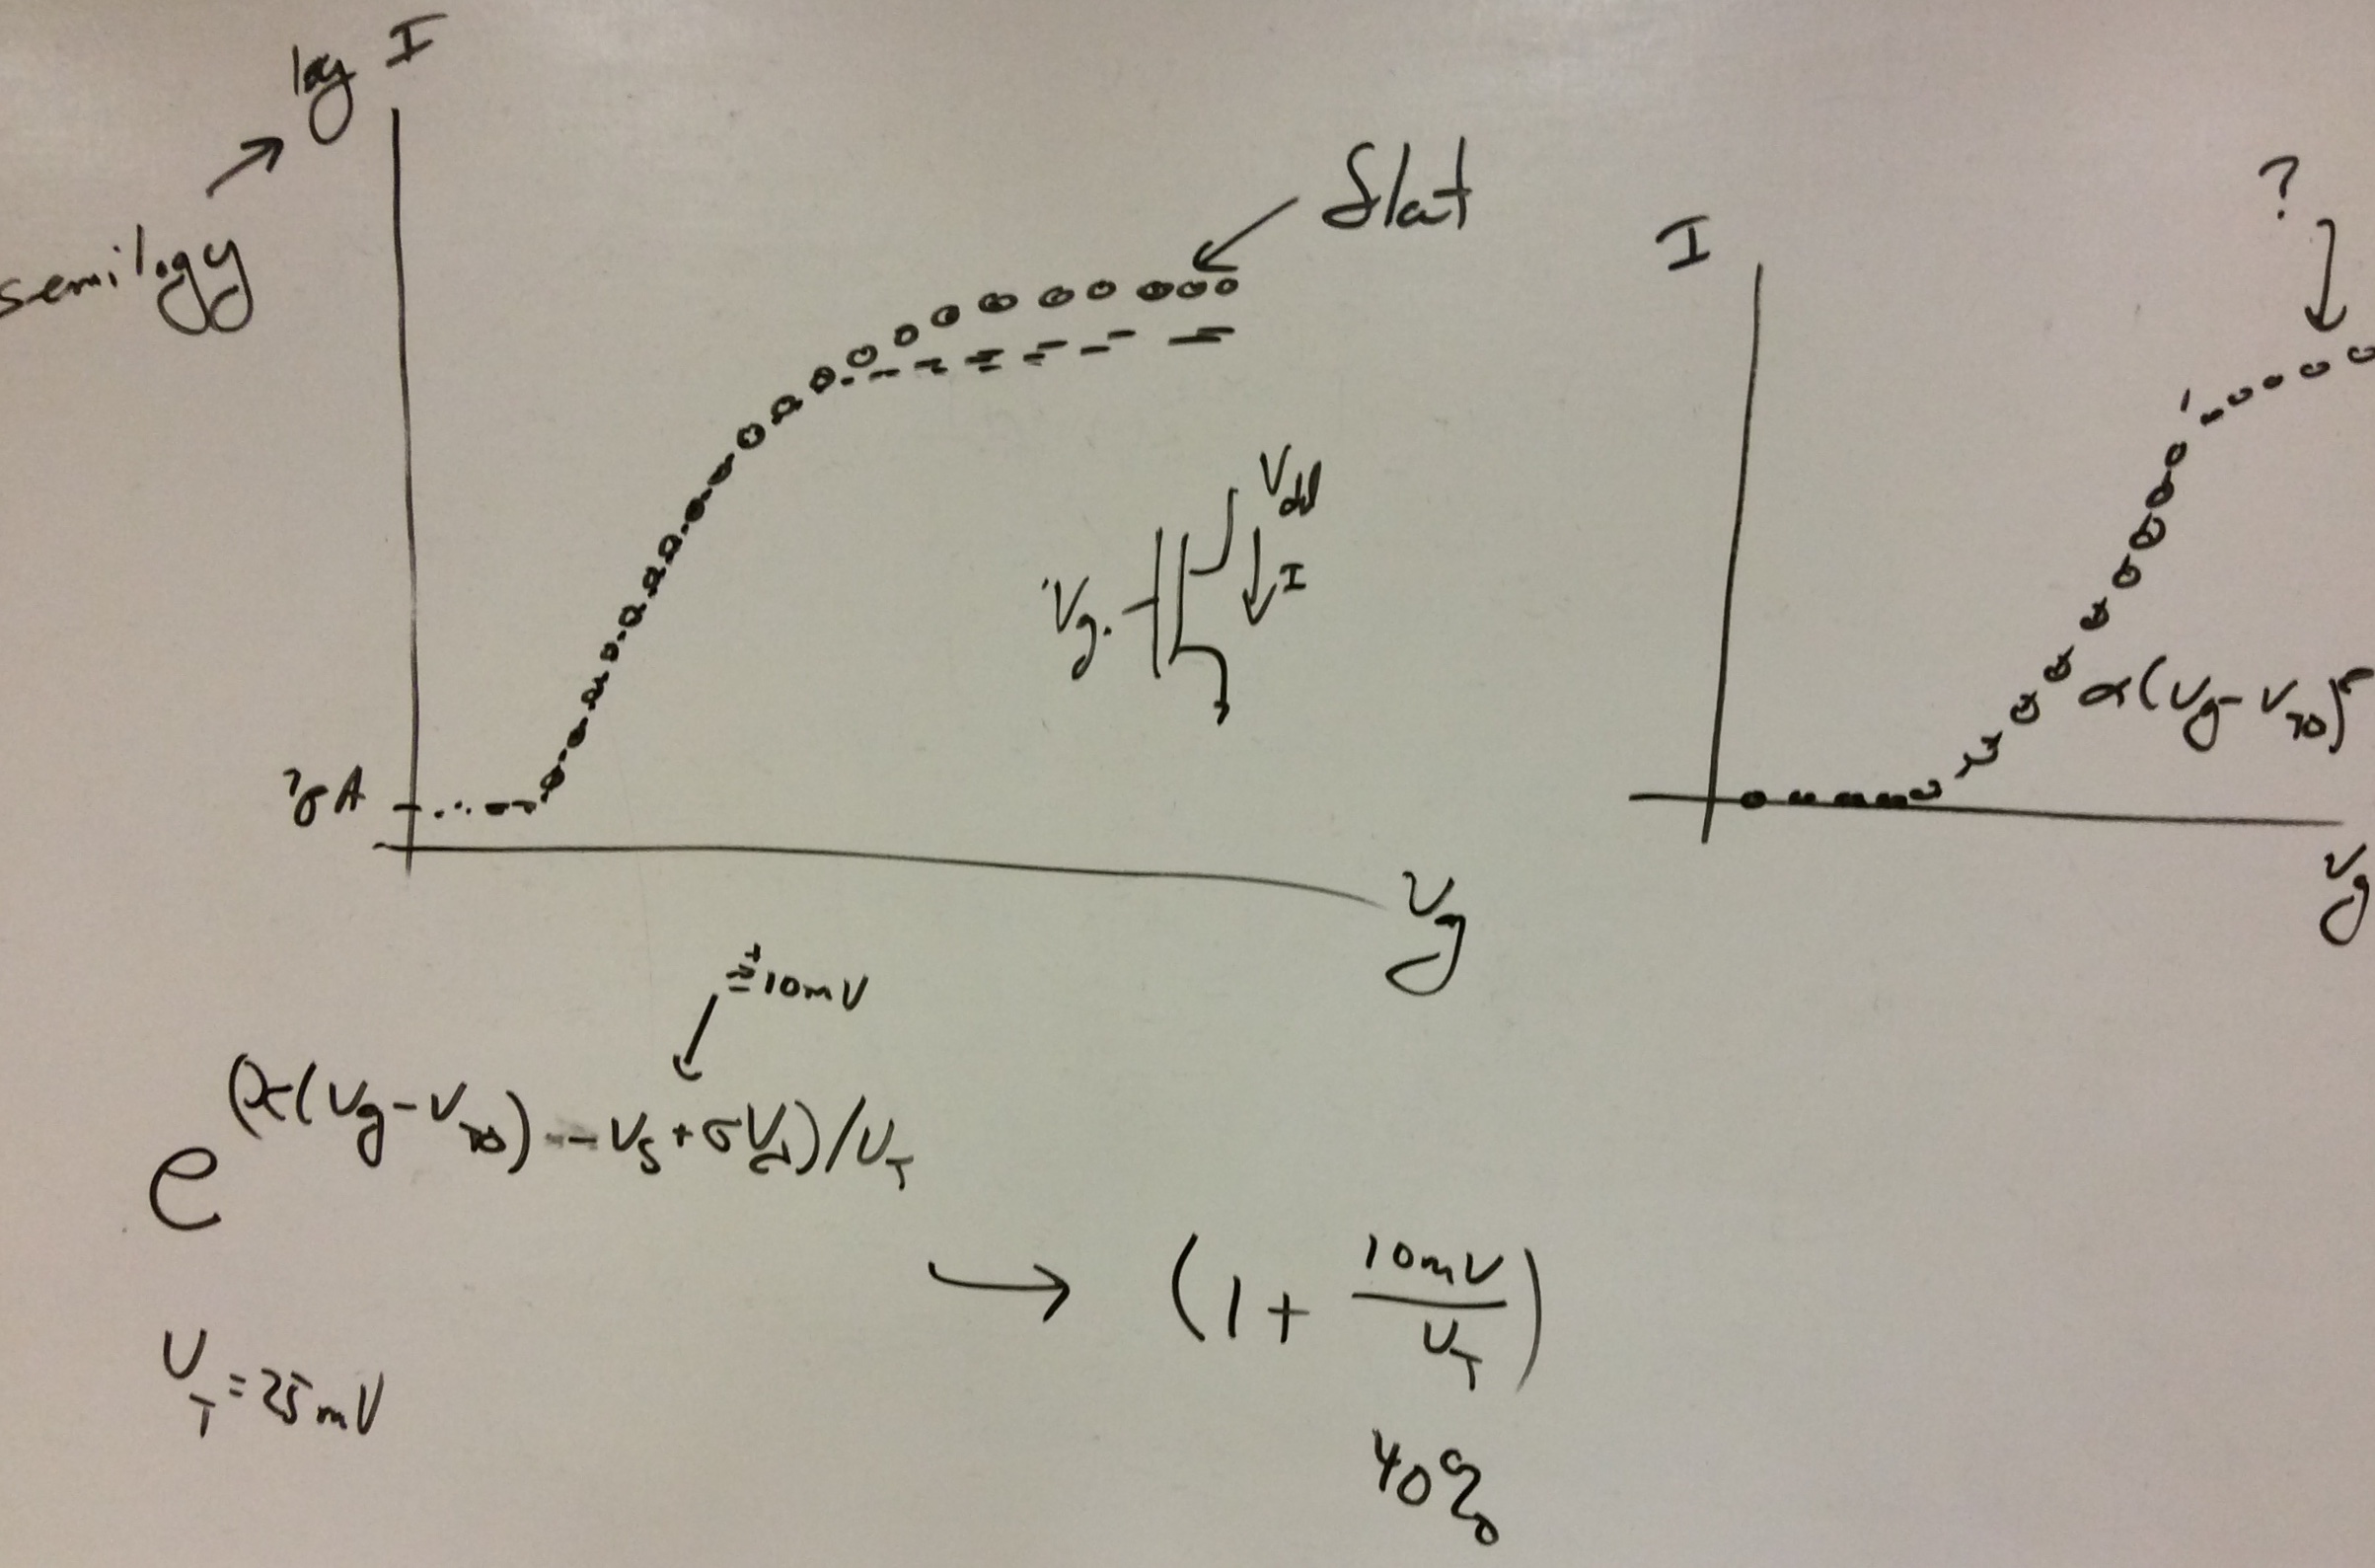
Source voltage sweep
Next we took a measurement of source current versus source voltage swept
for a device with the gate and drain voltage held at Vdd / GND (pFET / nFET)
for the device operating in saturation throughout the sweep.
Focus your measurements so you get primarily the subthreshold region
and some points just outside near the subthreshold region.
The data was taken at a temperature nearly equal to 300K.
You should include a figure for this experiment showing Ids versus Vs curve
showing subthreshold operation (exponential current).
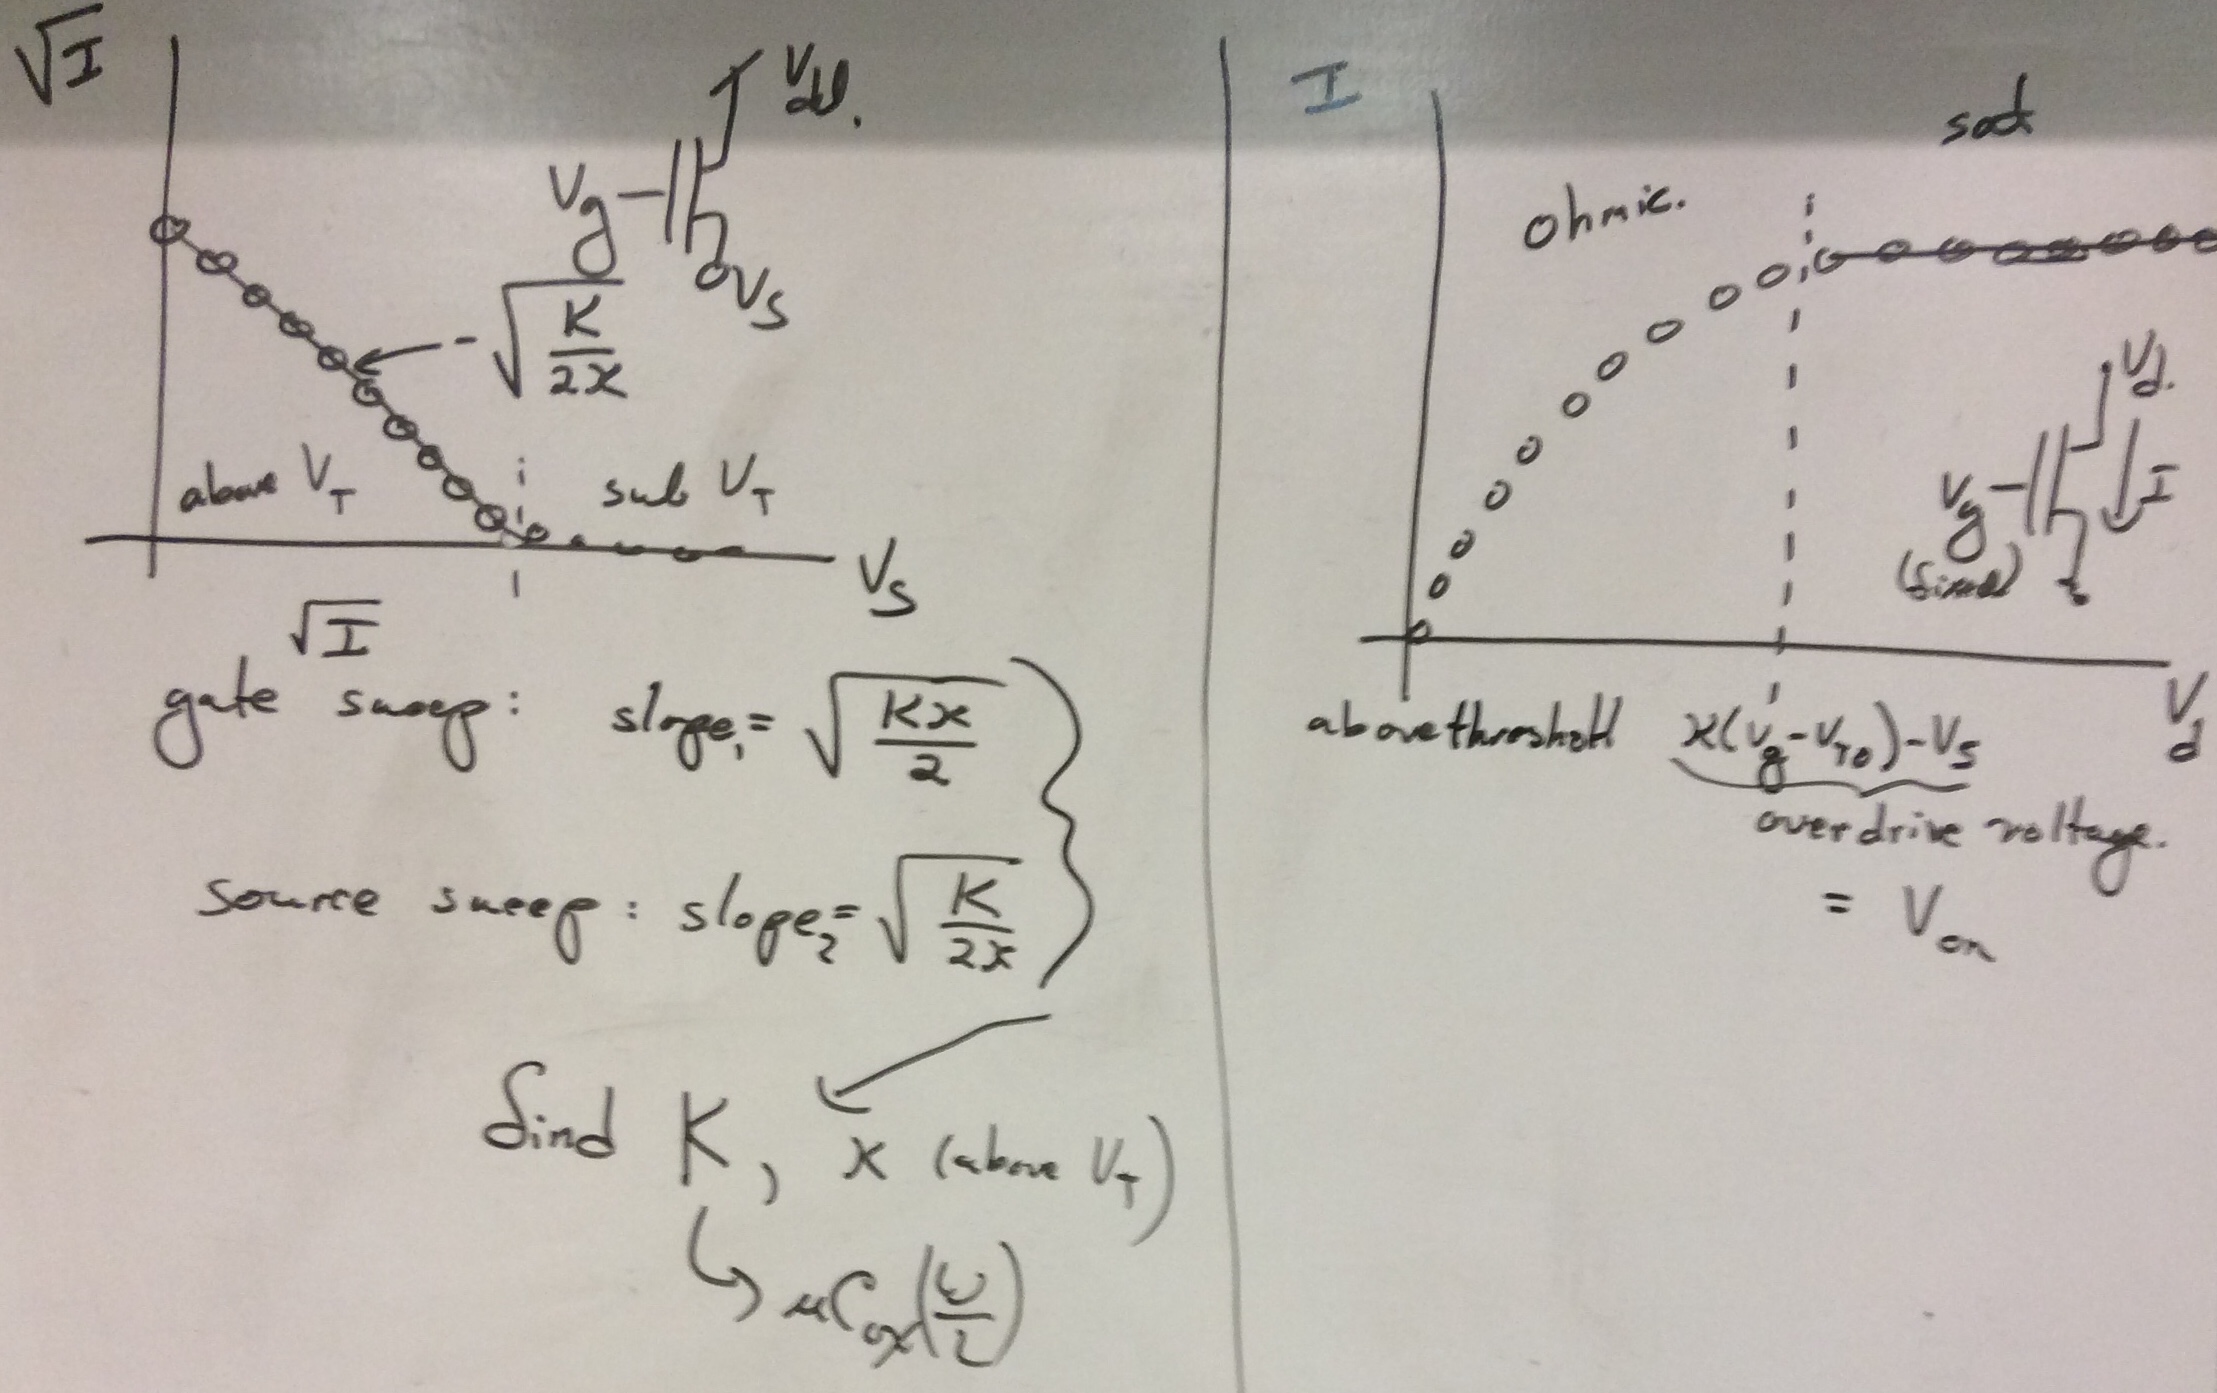
From the subthreshold graph, you should extract a value for UT.
Does this value agree with the expected value at room temperature?
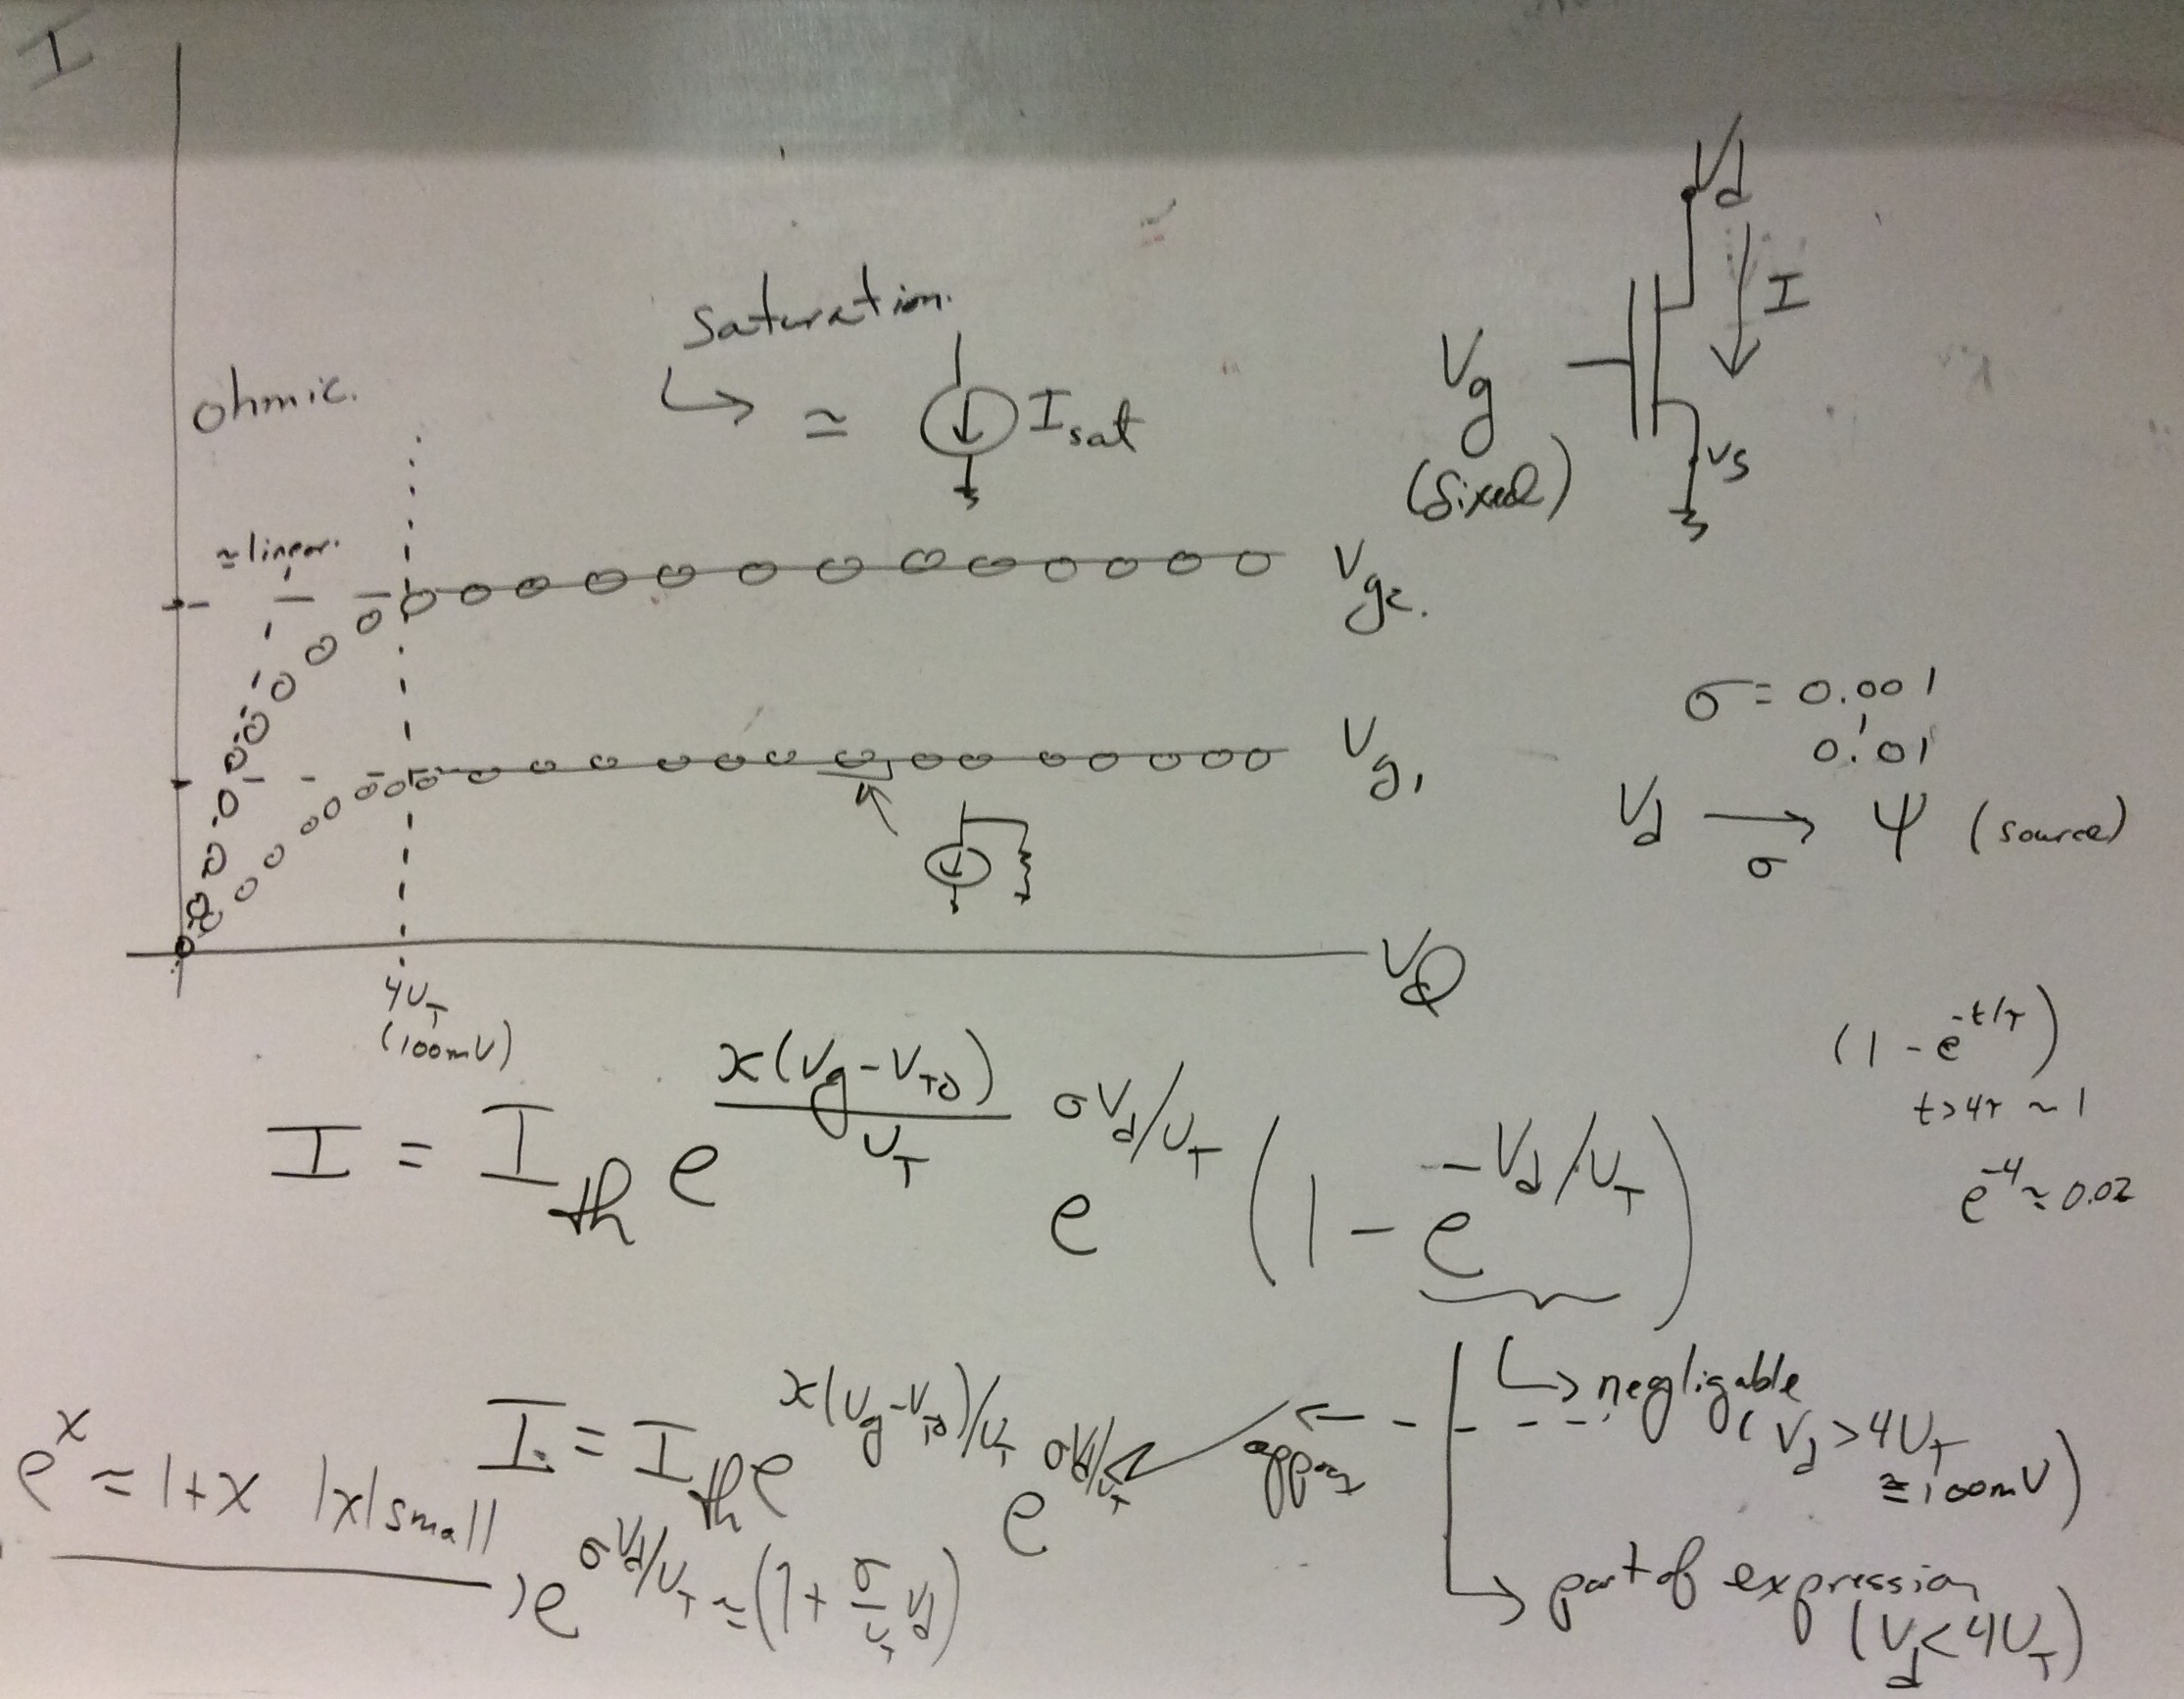
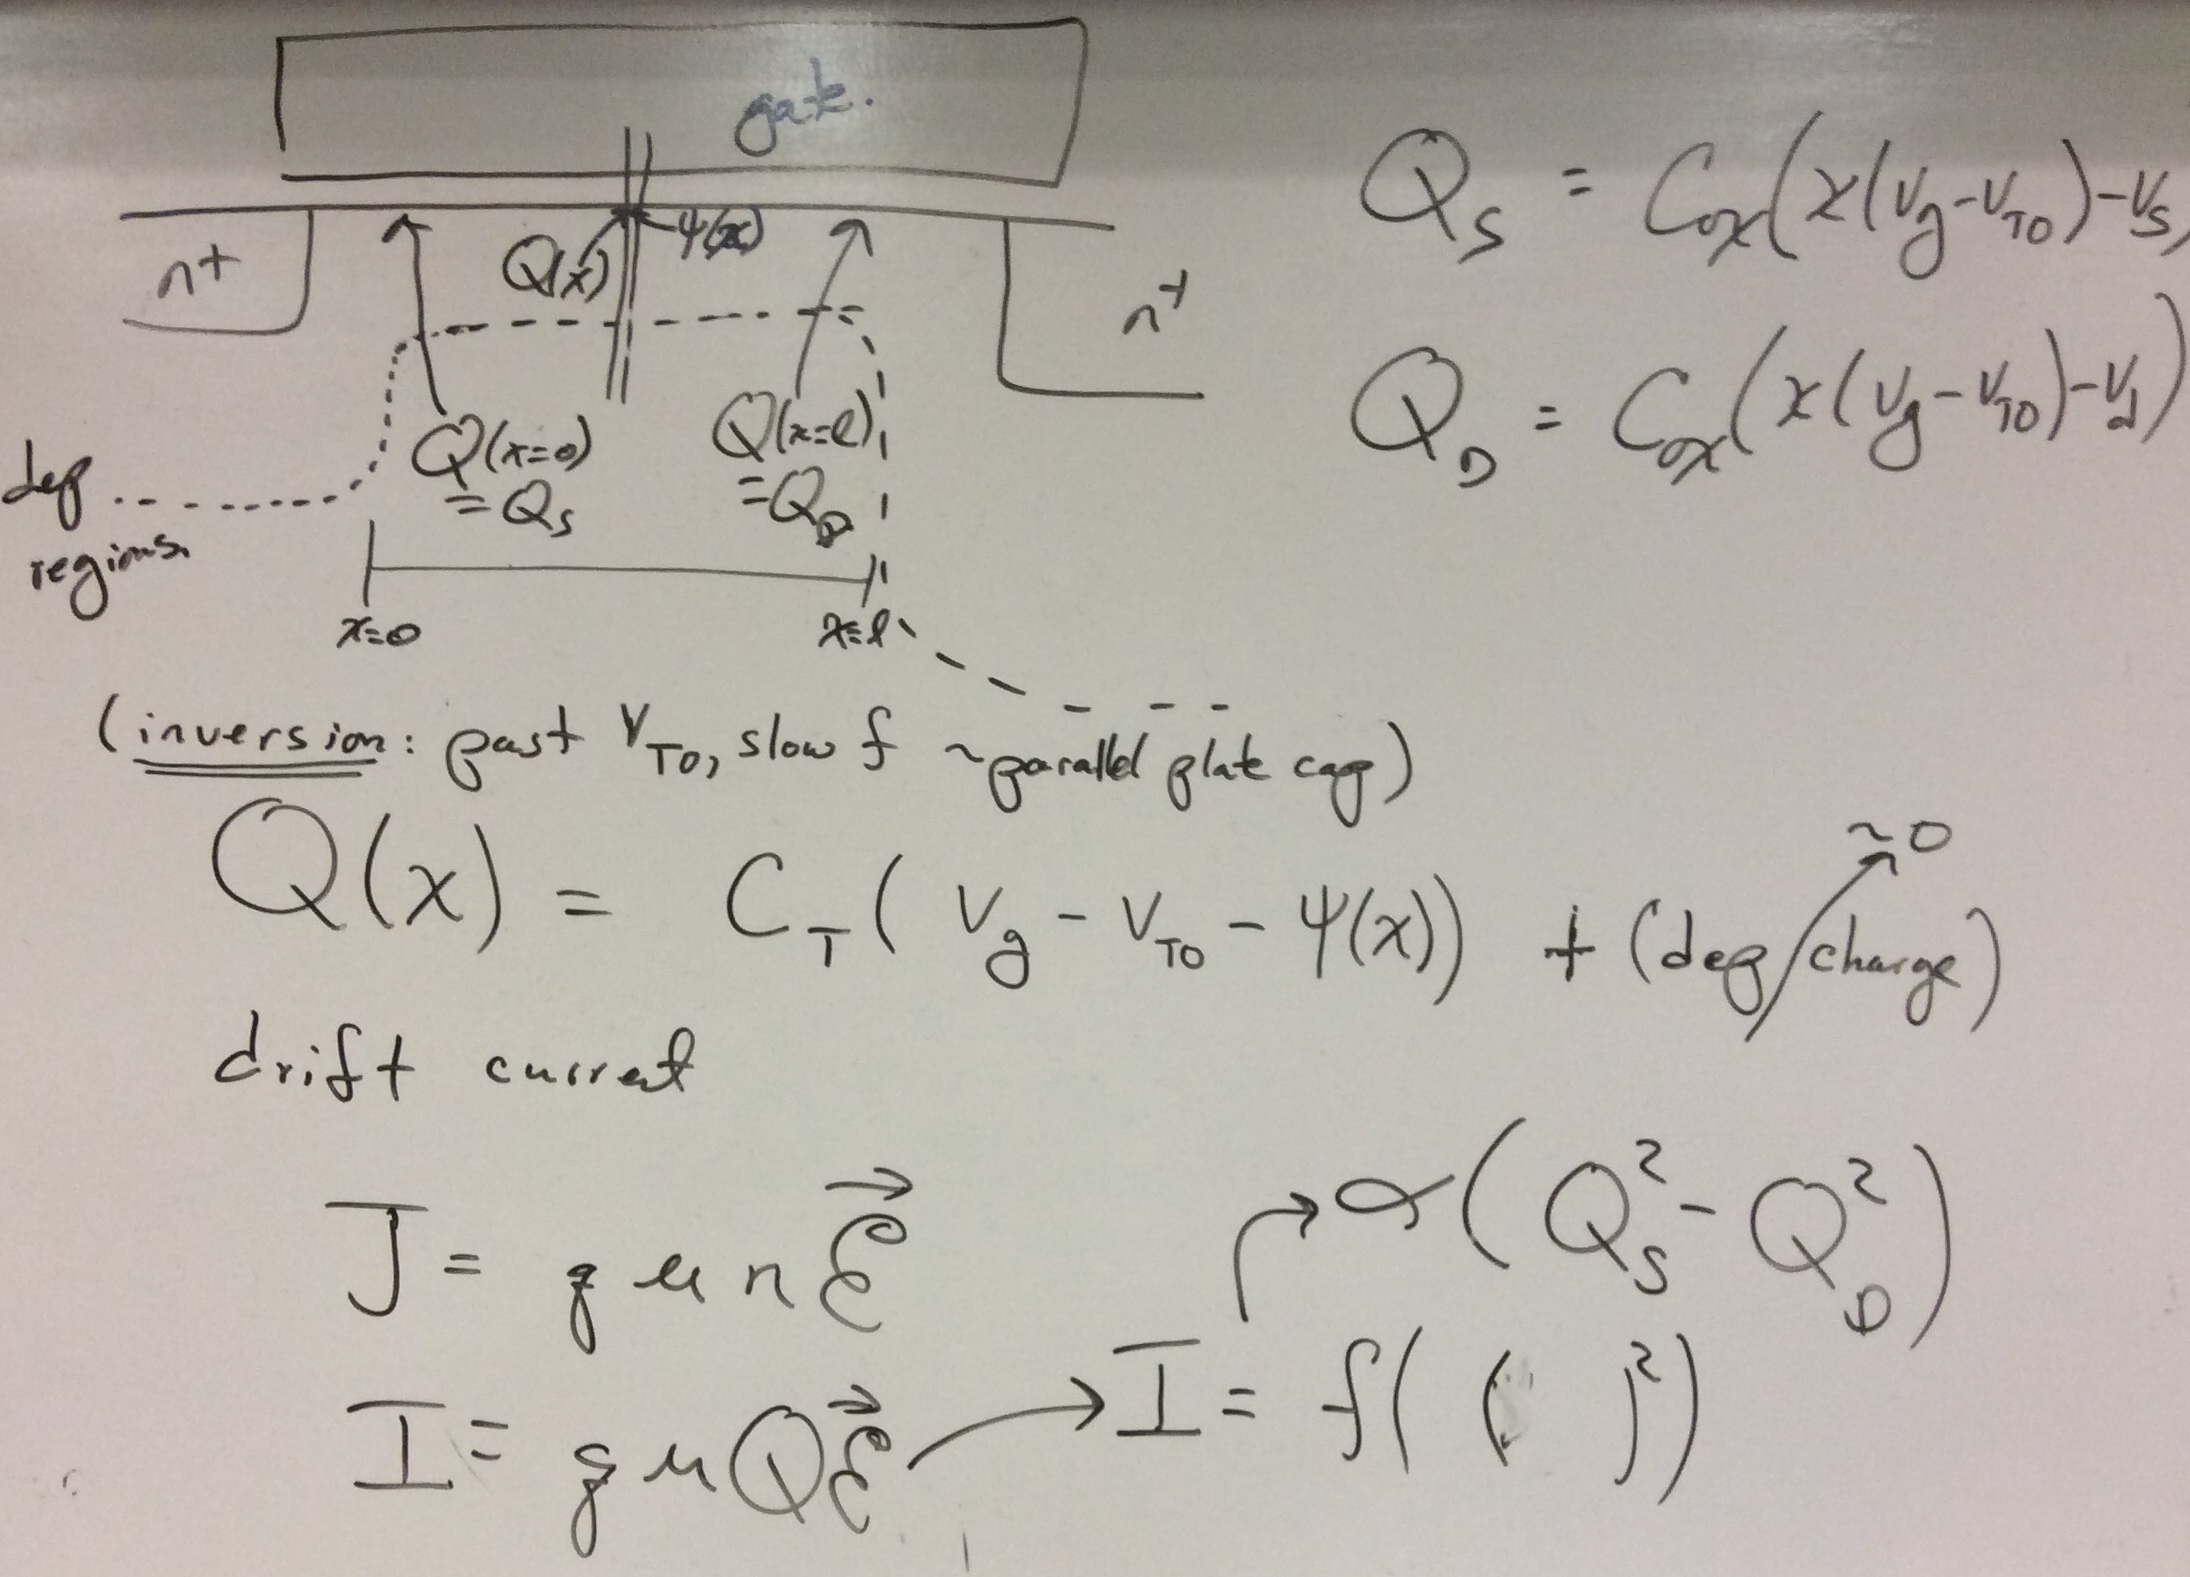
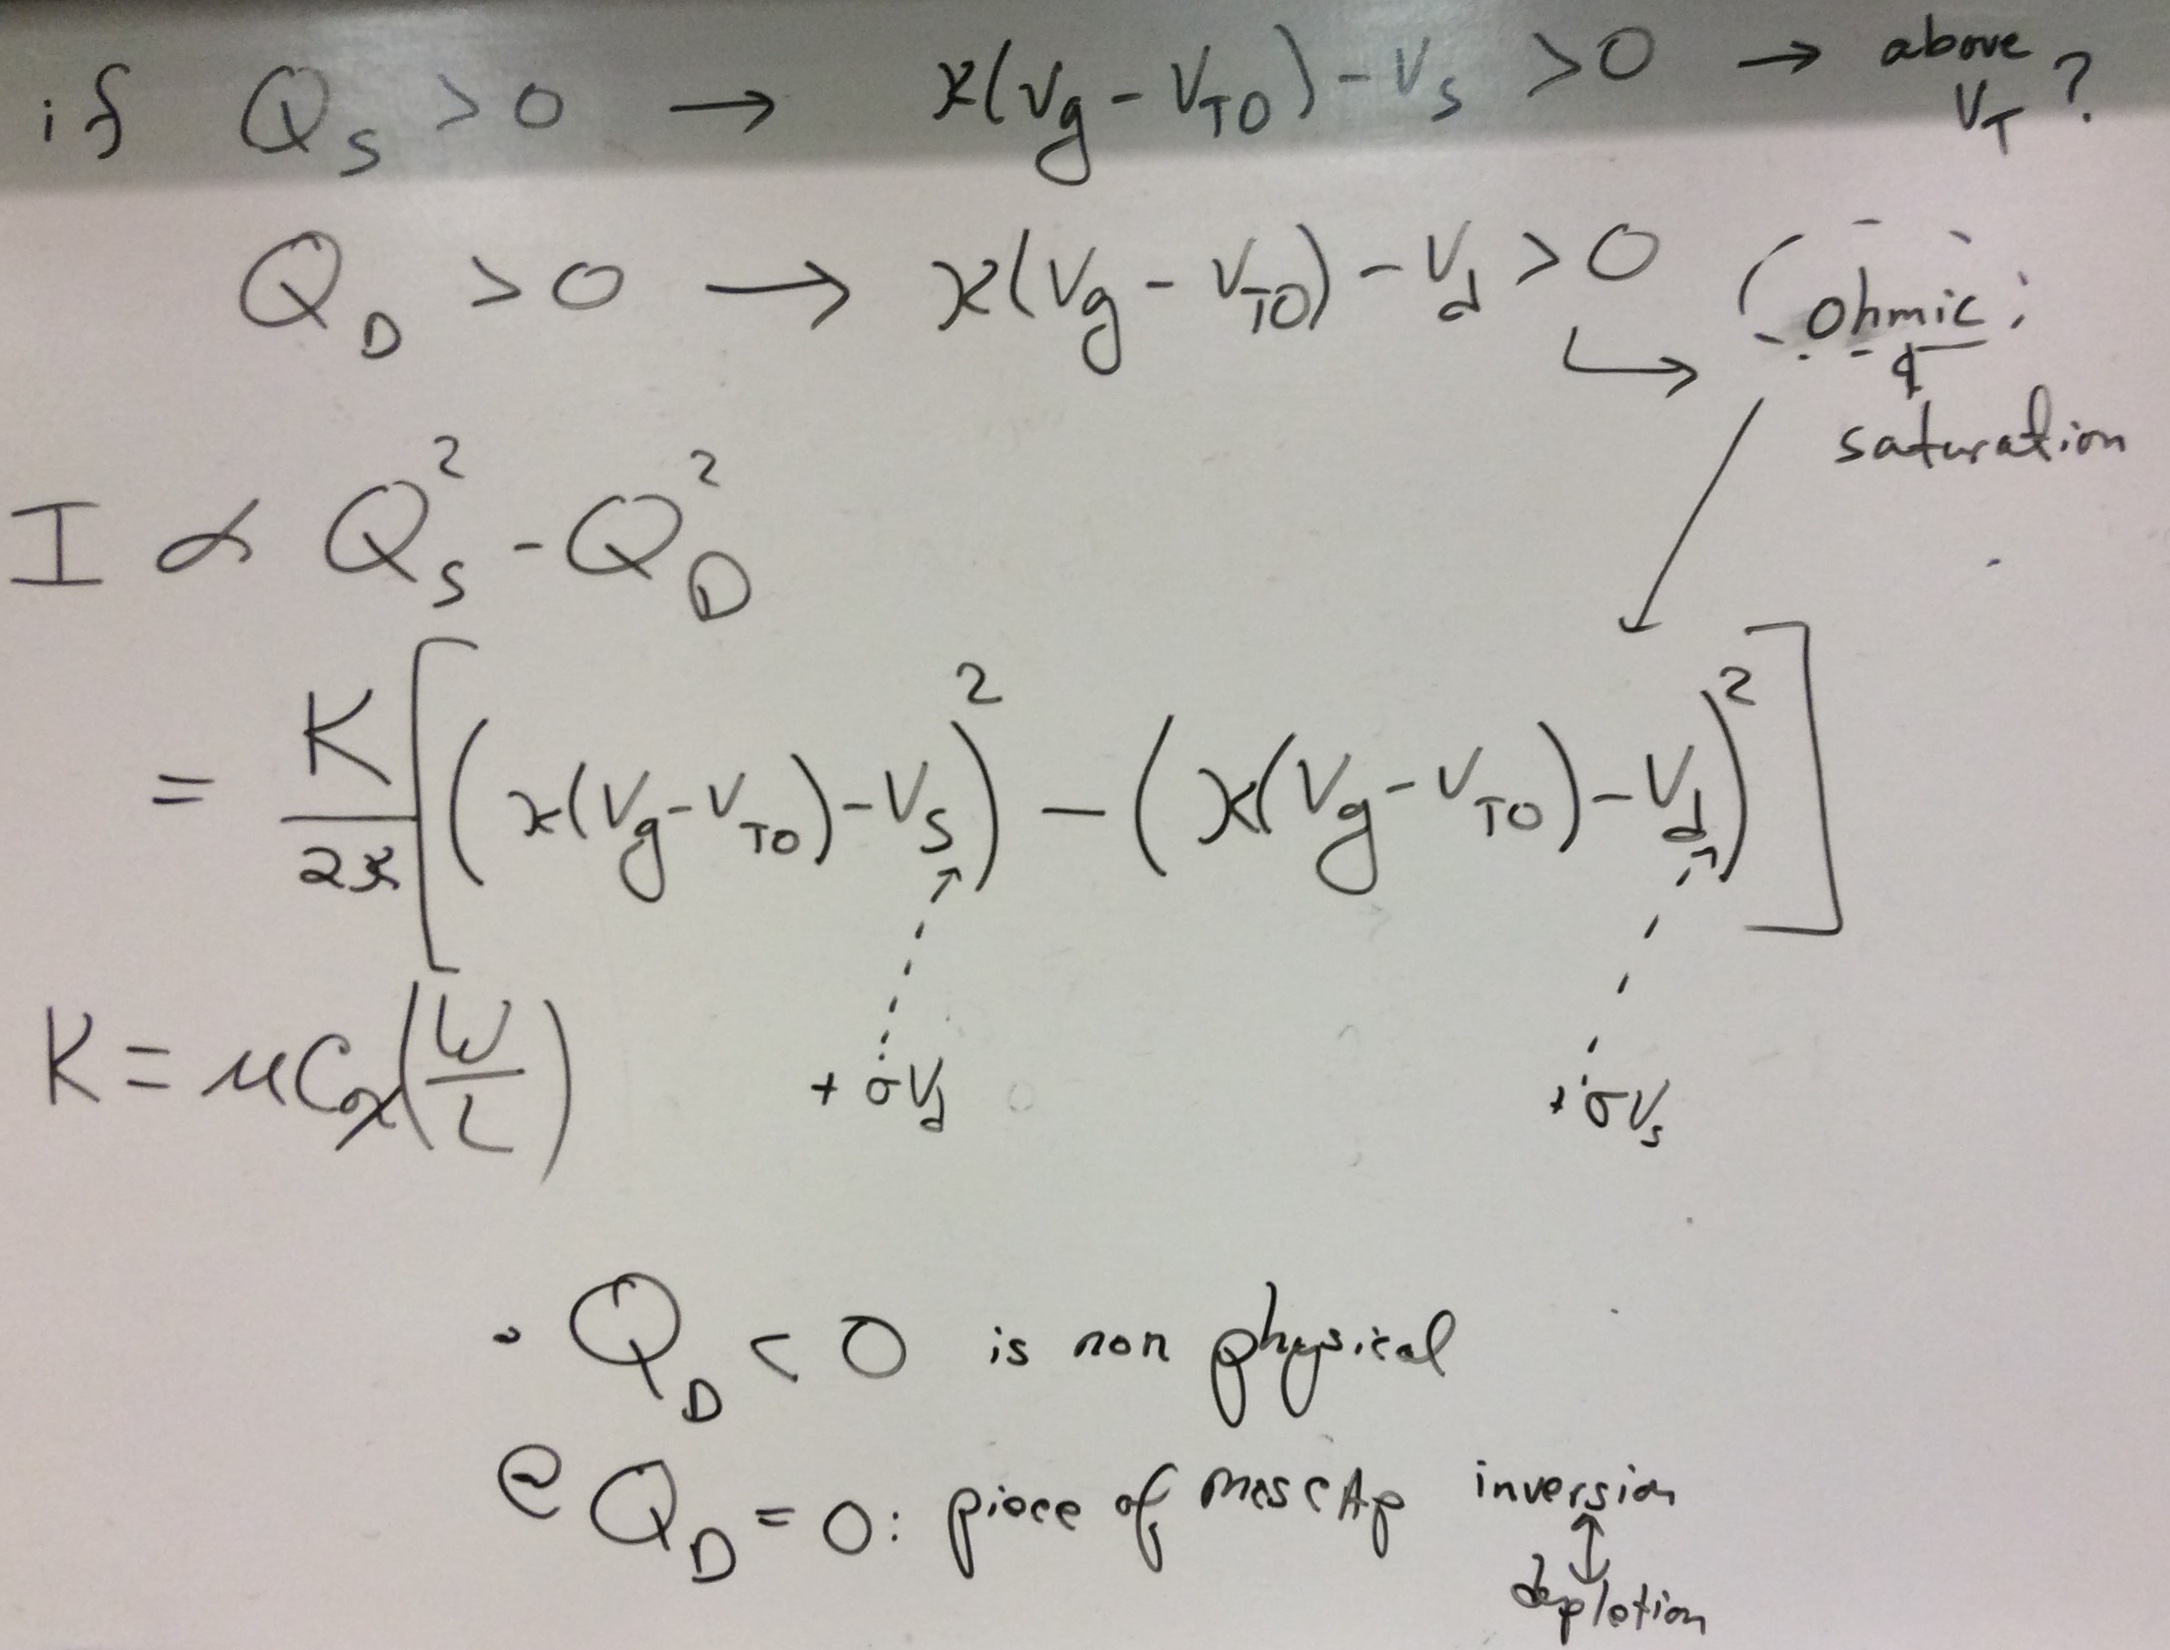
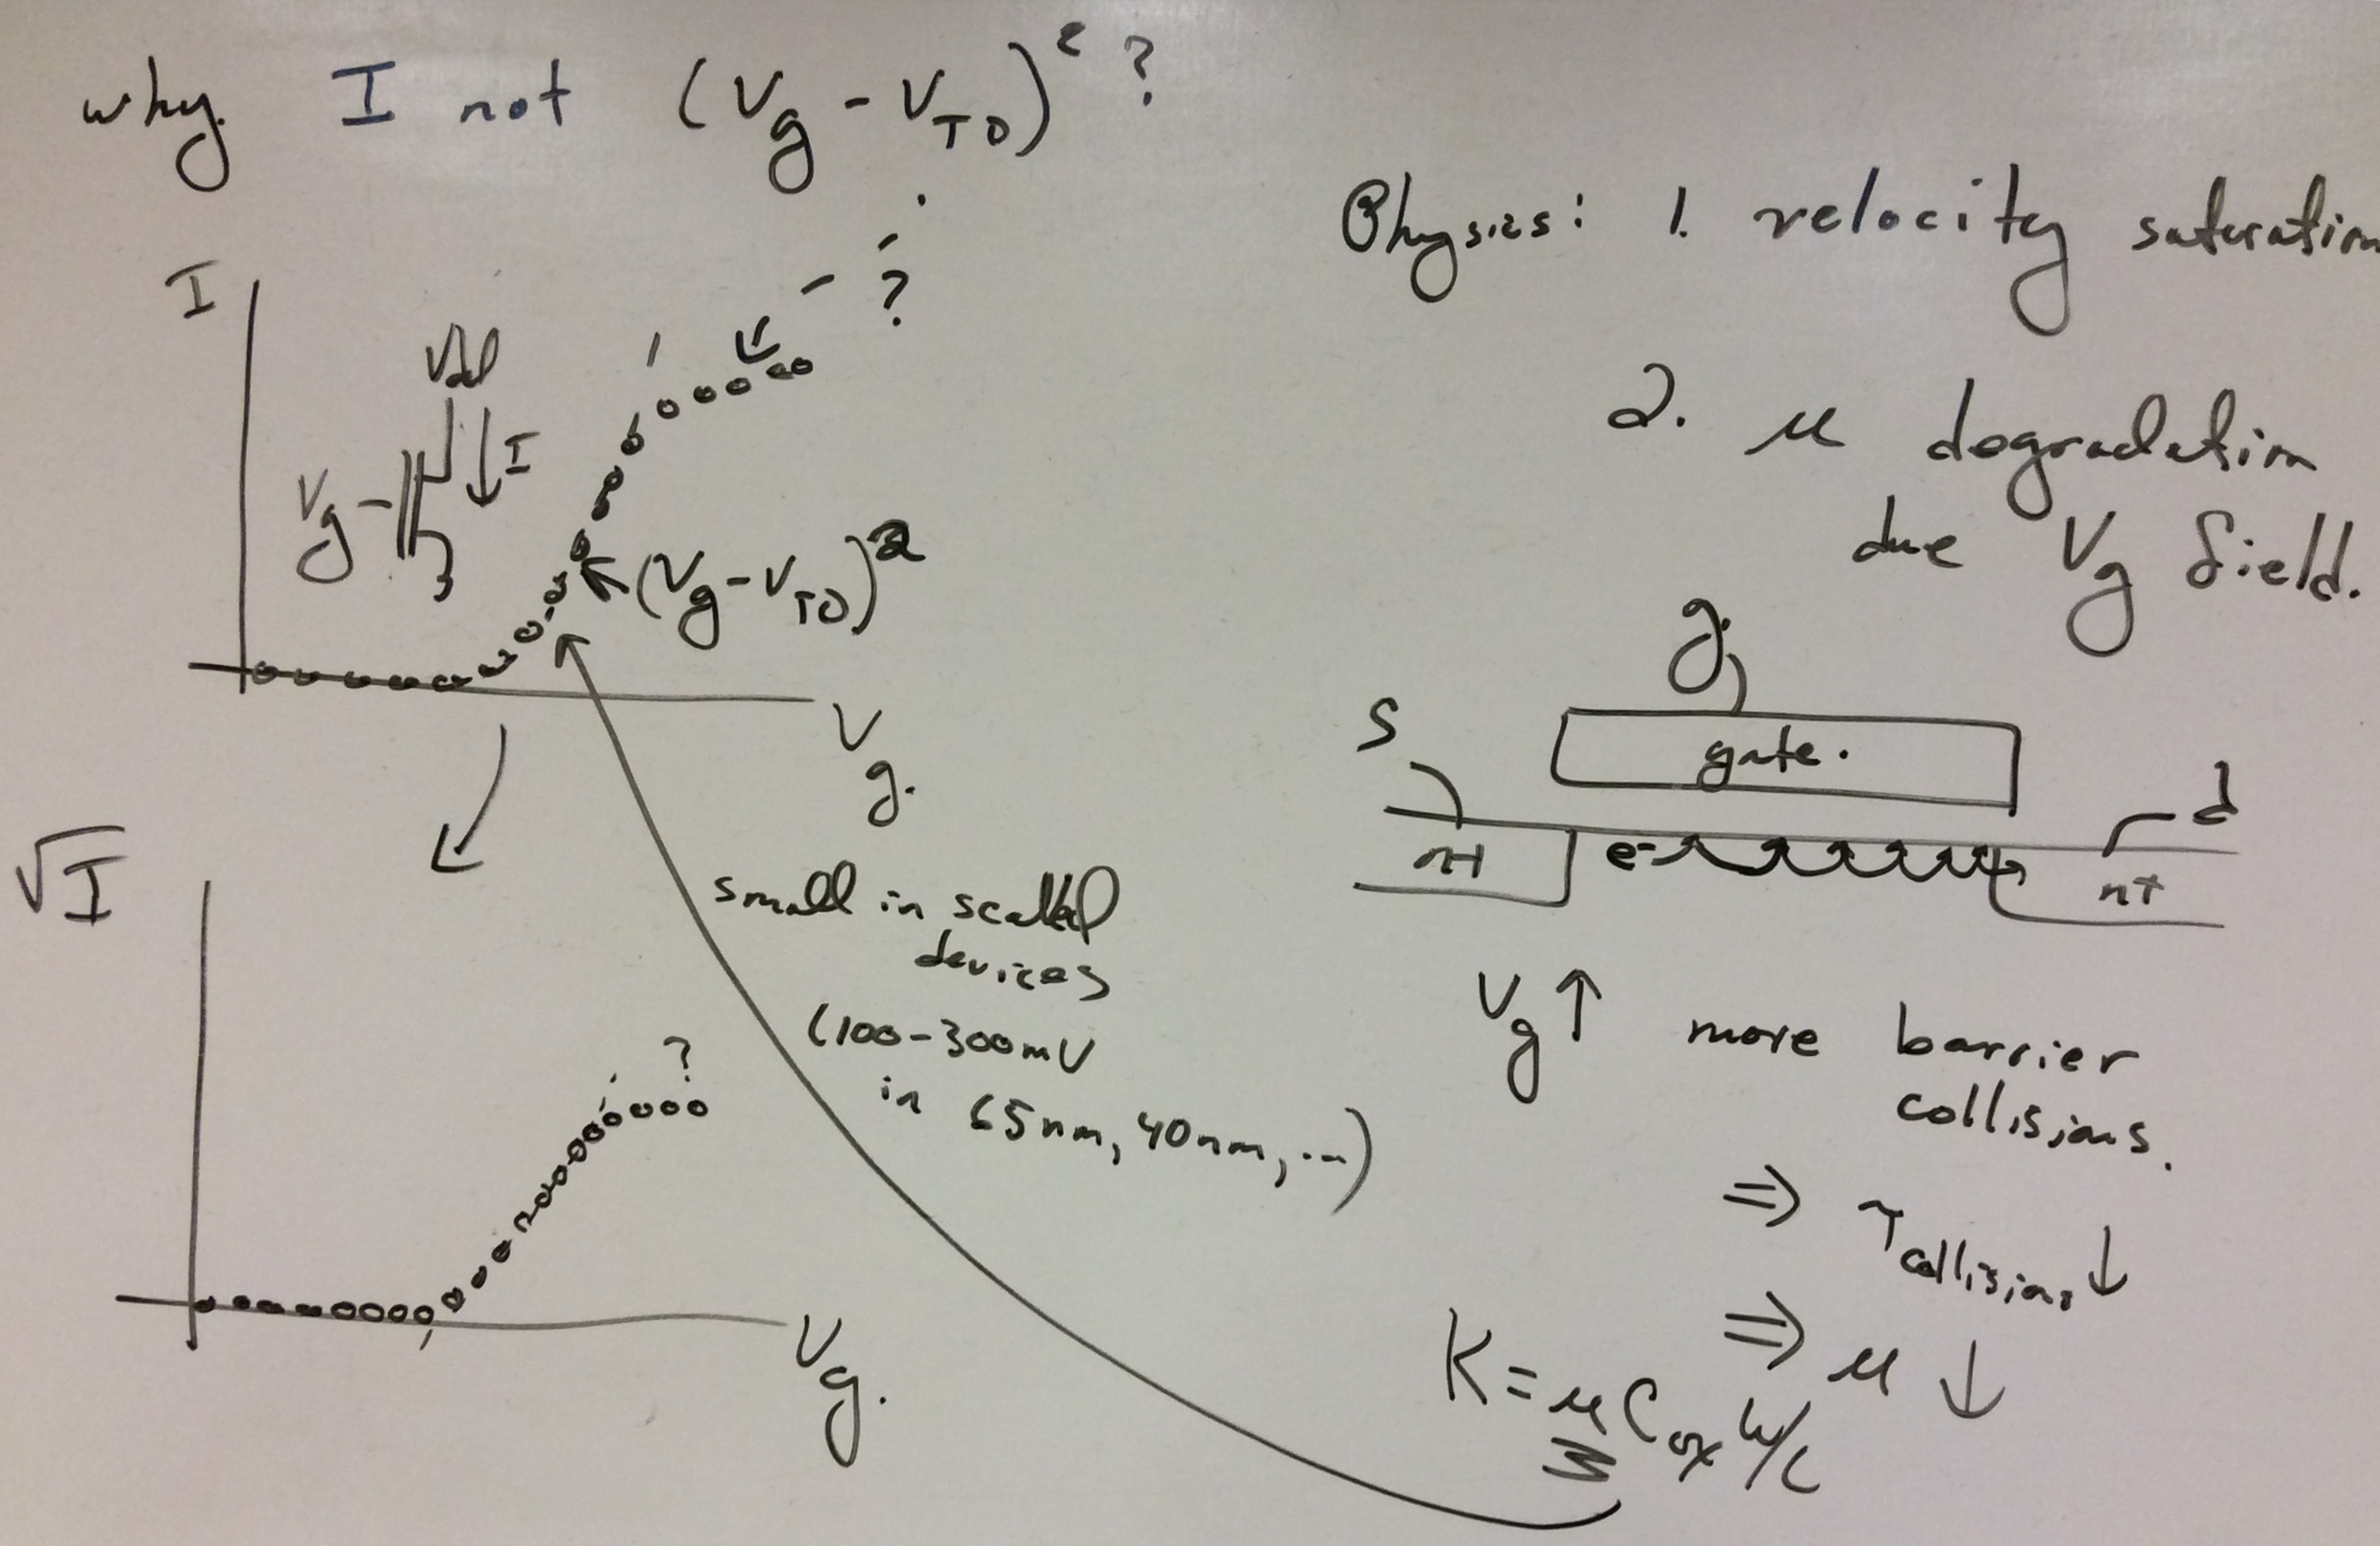
Drain voltage sweep
This experiment looks at the resulting drain current due to changes in drain voltage.
The dependance of Channel Current on Drain Voltage
will illustrate transistors are a Tunable Current Source,
as well as the Early Effect shows that deviation from an ideal current source.
In this experiment you find the Early voltages from measured data of source current versus drain voltage for an nFET device of length of 2 microns.
For the experimental measurements of the source current as a function of drain voltage
from an nFET and pFET for fixed voltages on the gate, drain, and bulk,
you should:
( the source voltage is connected to ground or 0V for the nFET and 2.5V for the pFET,
and the gate was connected to a fixed voltage for the nFET and pFET)
- Find the Early voltage from measured data of source current versus drain voltage. Perform the appropriate curve fit through the saturated range of the data. It is helpful to select a one to two volt range of drain voltage for these fits
- Perform a simulation (same tools) that gives similar results using the parameters you previously obtained.
- Make a plot of the data, indicate the saturated and ohmic regions, and resulting curve fit to these two
regions. Identify the drain-to-source voltage was required to reach saturation. Identify on your graphs where the devices are in saturation and where they are in the ohmic regime.
Label these curves with the values of Idsat, and VA.
Is this curve taken in subthreshold or above-threshold operation? How could you tell just from your data plot?
Finishing up the model
In the presentation, there should be a final table of extracted parameters.
Further, after the parameters you have curve fit,
and say a starting value for "sigma" that you got for your drain sweeps,
you should modify the existing model in Scilab / Xcos
for your transistor data, and should have this simulation data
overlapping your obtained measured data.
You should use point markers (e.g. 'o') for data and straight lines for curve fits and sims. Avoid
using a legend, but rather identify the graphs directly with the data where possible. You should show a curve fit in a reasonable region (not over the entire graph).
For your presentation, you really only need three plots (if you put it together well),
one for gate sweep and source sweep for all of your devices, with curve fits,
and simulation data.
Additional Data Examples
We wanted to include examples from previous classes for your reference.
These examples come in the form of a report,
but remember, you are not turning in a report,
but as a team, you turn in a 5-7 minute video of your presentation.
Two video examples for this project are
example 1
and
example 2 .
The grading rubrics for this class is shown
here
How we turn in the project has completely changed,
as well as we use a different data set,
but we use the same IC process.
Examples from older classes (where a report was required)
are
-
here for the first example,
and
-
here for the second example.
One should not assume everything is correct in these writeups;
I make no comment on what is or is not correct other than I would probably not
put up a project that is not reasonably good.
The material may or may not correlate to what you need to do for your project,
although the fact I have included it means it might be helpful.
Another set of experimental data for this project:
You don't have to do anything with this data, but you might find it helpful.
-
Static measurements of channel current versus gate voltage.
The source was held to 0V, and the drain was held to 3.3V so that the device would stay in the saturation regime.
The data is in two column format.
nFET Data: [gate-voltage channel-current]
pFET Data: [gate-voltage channel-current]
-
Static measurements of channel current versus source voltage.
We are measuring the source current as a function of
source voltage from an nFET for fixed voltages on the
gate (=5V), drain (=5V), and bulk (=0V).
The transistor was biased to stay in saturation throughout this sweep.
The data is in two column format.
nFET Data: [source-voltage drain-current]
pFET Data: [source-voltage drain-current]
-
Static measurements of channel current versus drain voltage.
We are measuring the source current as a function of
drain voltage from an nFET for fixed voltages on the
gate (=0.5V), source (=0V), and bulk (=0V).
The data is in two column format.
nFET Data: [drain-voltage drain-current]
pFET Data: [drain-voltage drain-current]