Topics
These are the core topics for Unit 3.
These topics are what what would be covered in the exam for Unit 3.
- Fourier Transform and Frequency Response
- Sinusoids and Linear Circuits
- Designing R, L, C circuits (e.g. Filters)
Class Schedule, Topics, Taped Lectures
The particular taped lectures should be watched before class session.
My photographs of the lecture boards will be posted soon after all lectures are finished.
|
Date
|
Class Topic
|
On-Line Lectures
|
White Boards
| |
Oct 13
|
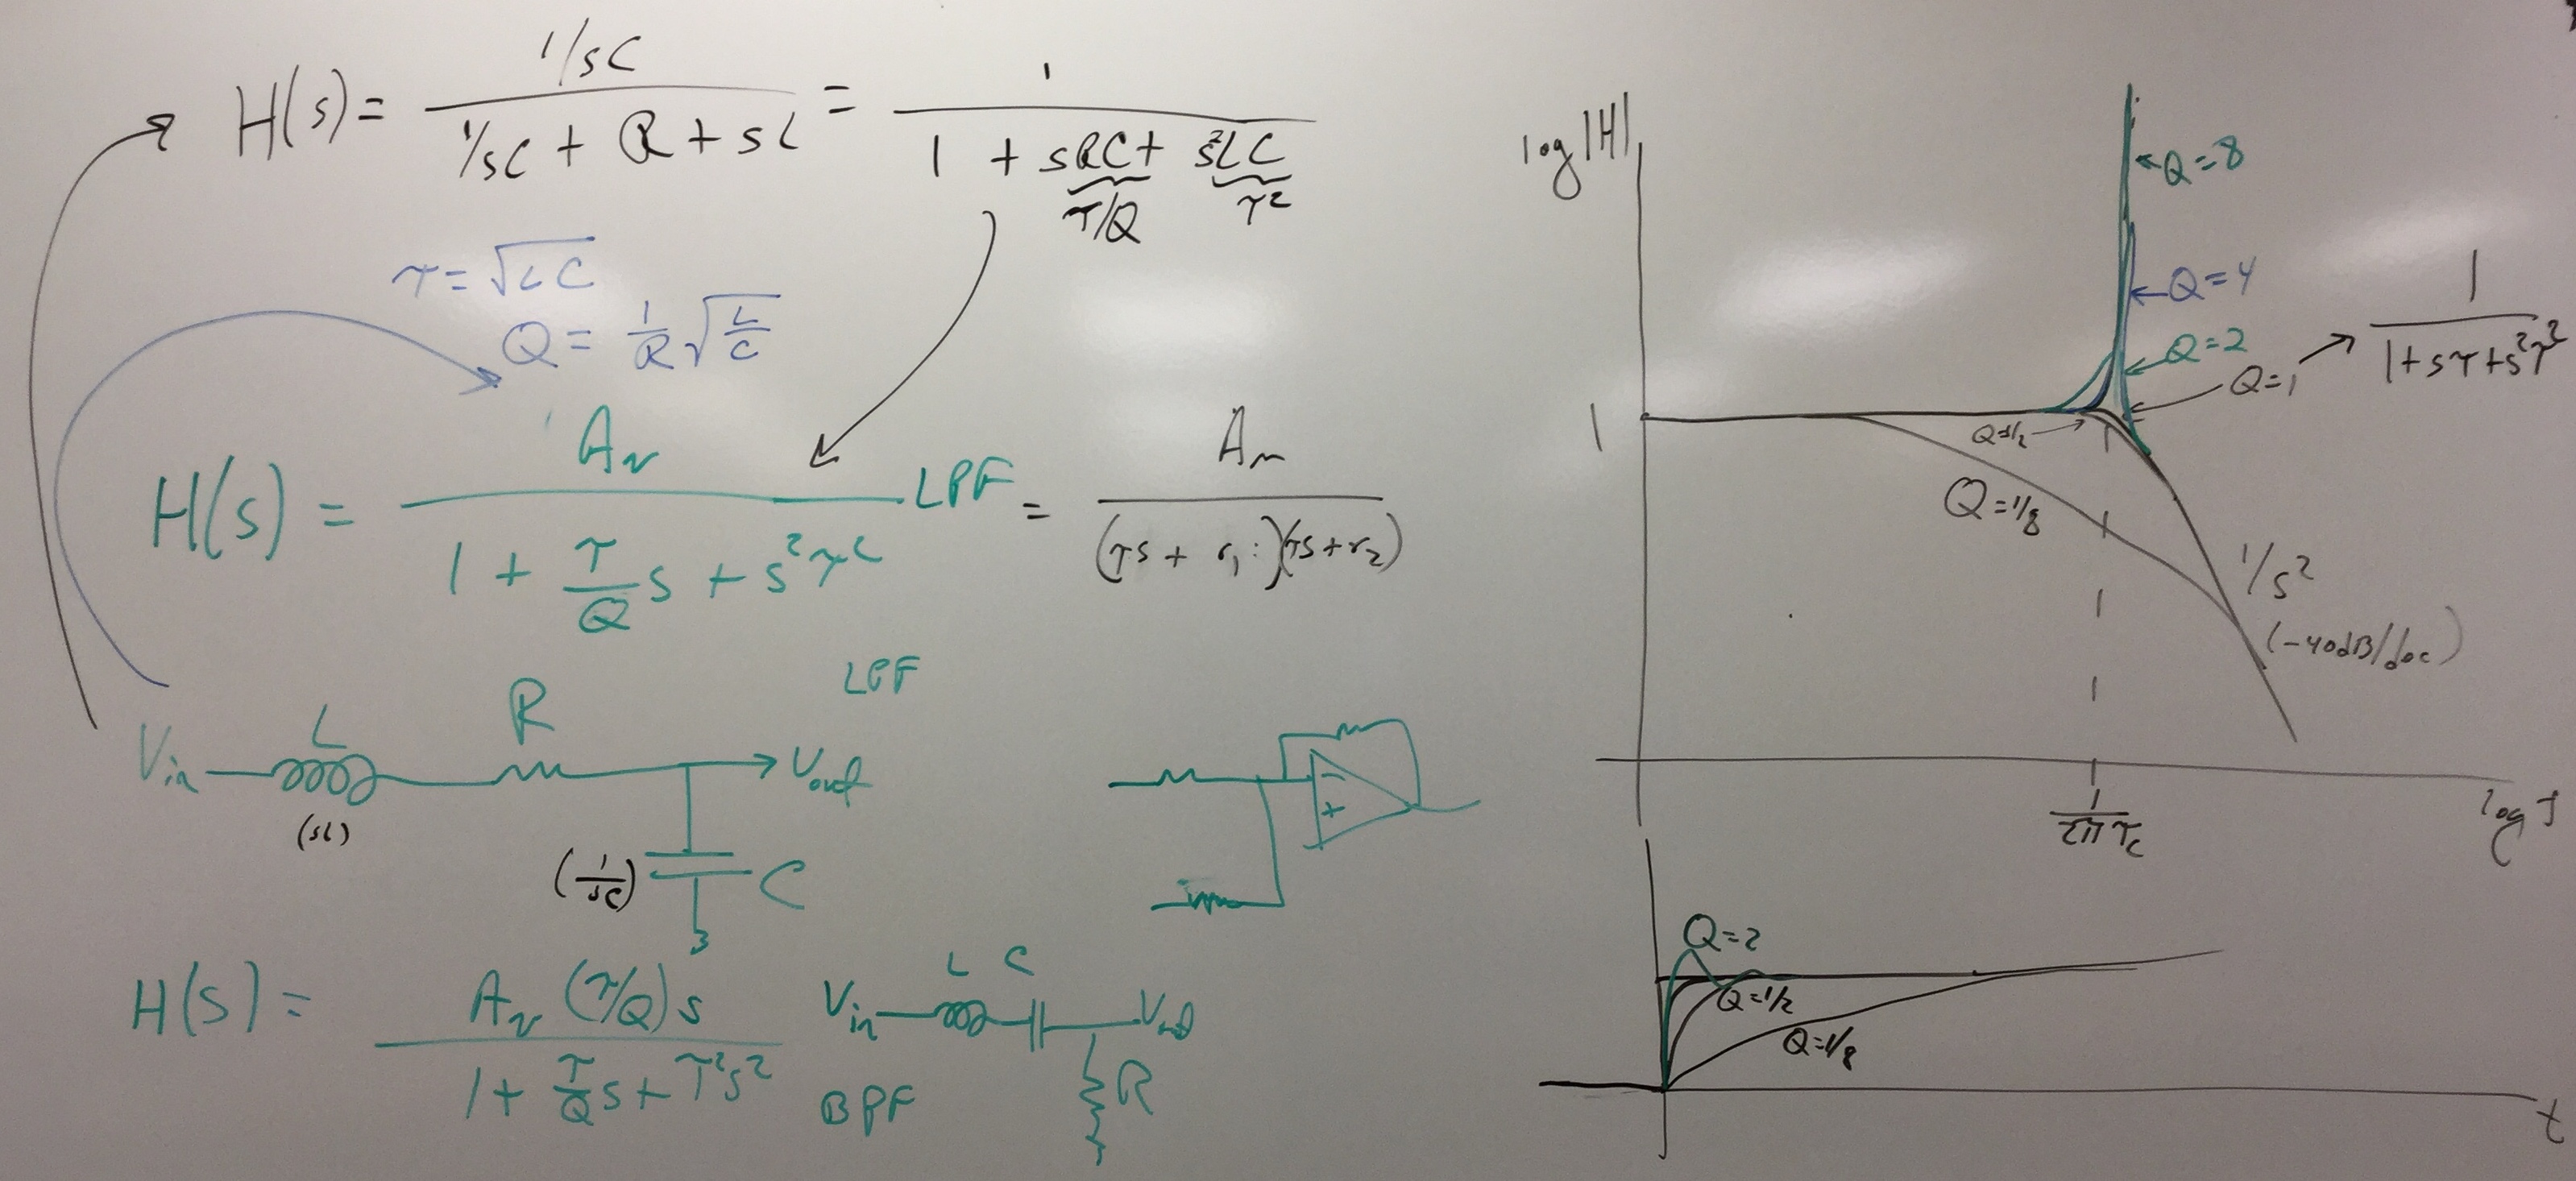
Frequency Response
|
Intro,
LPF SOS,
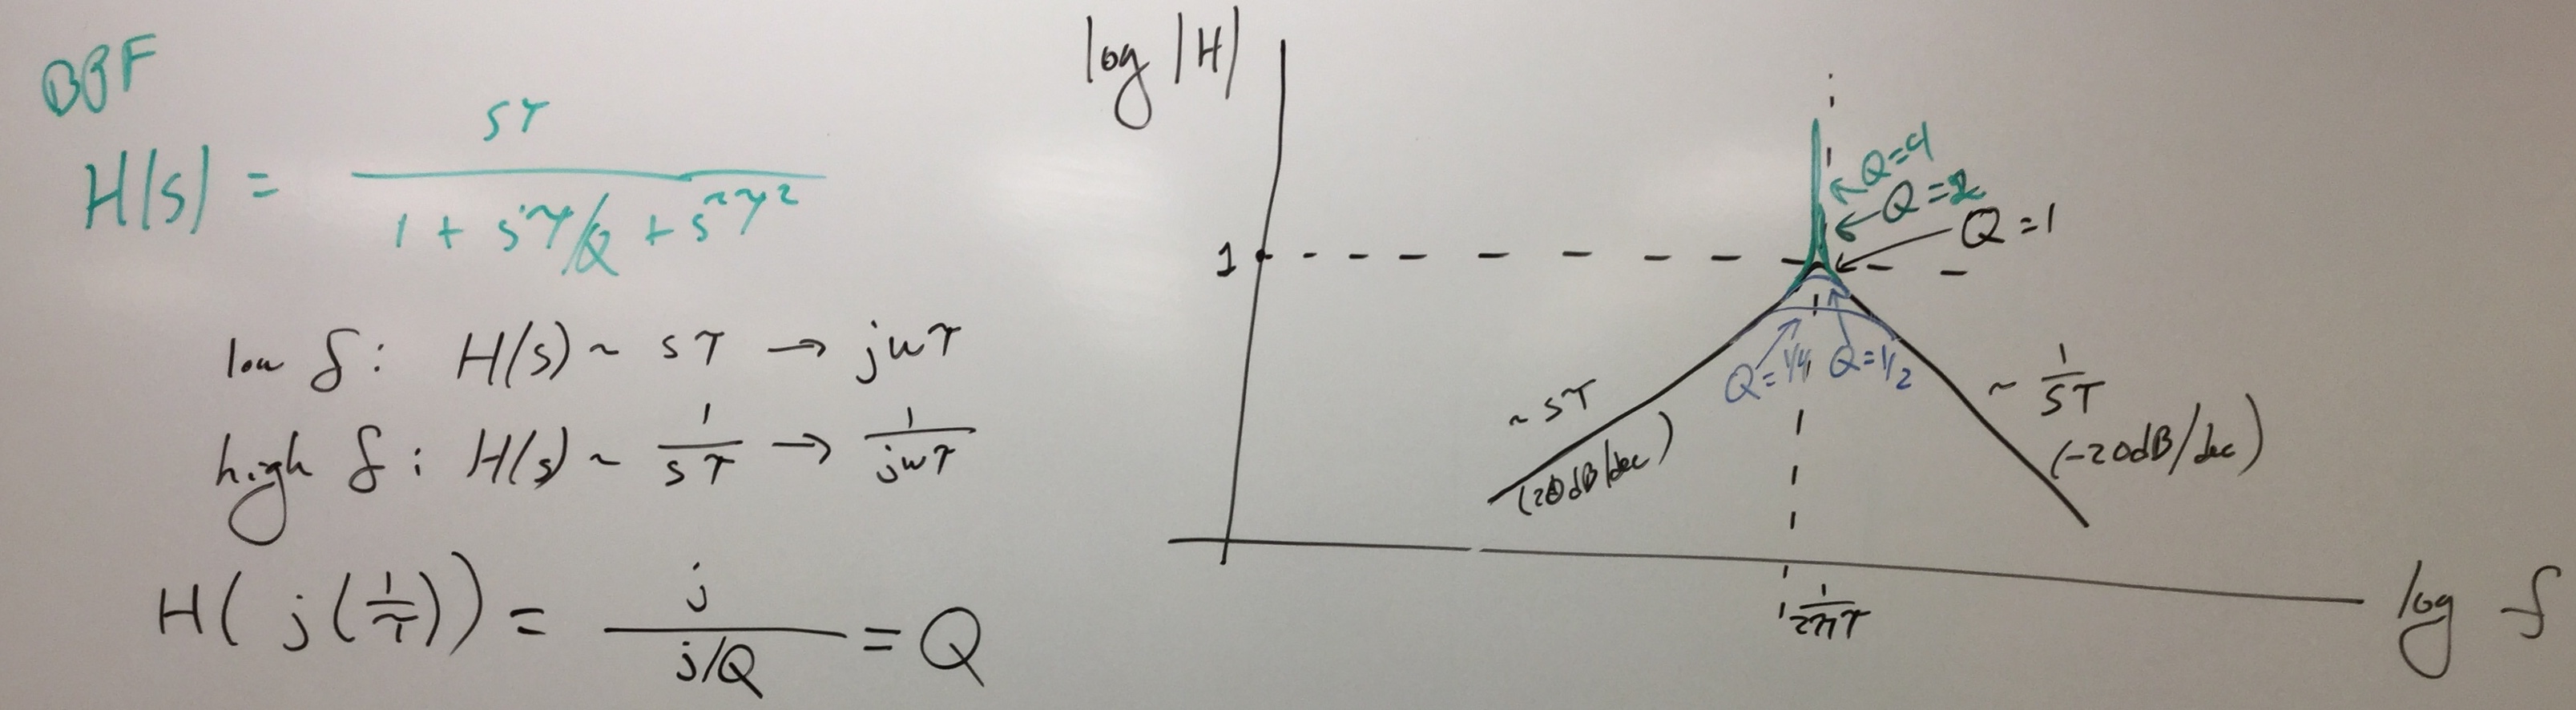
BPF SOS,
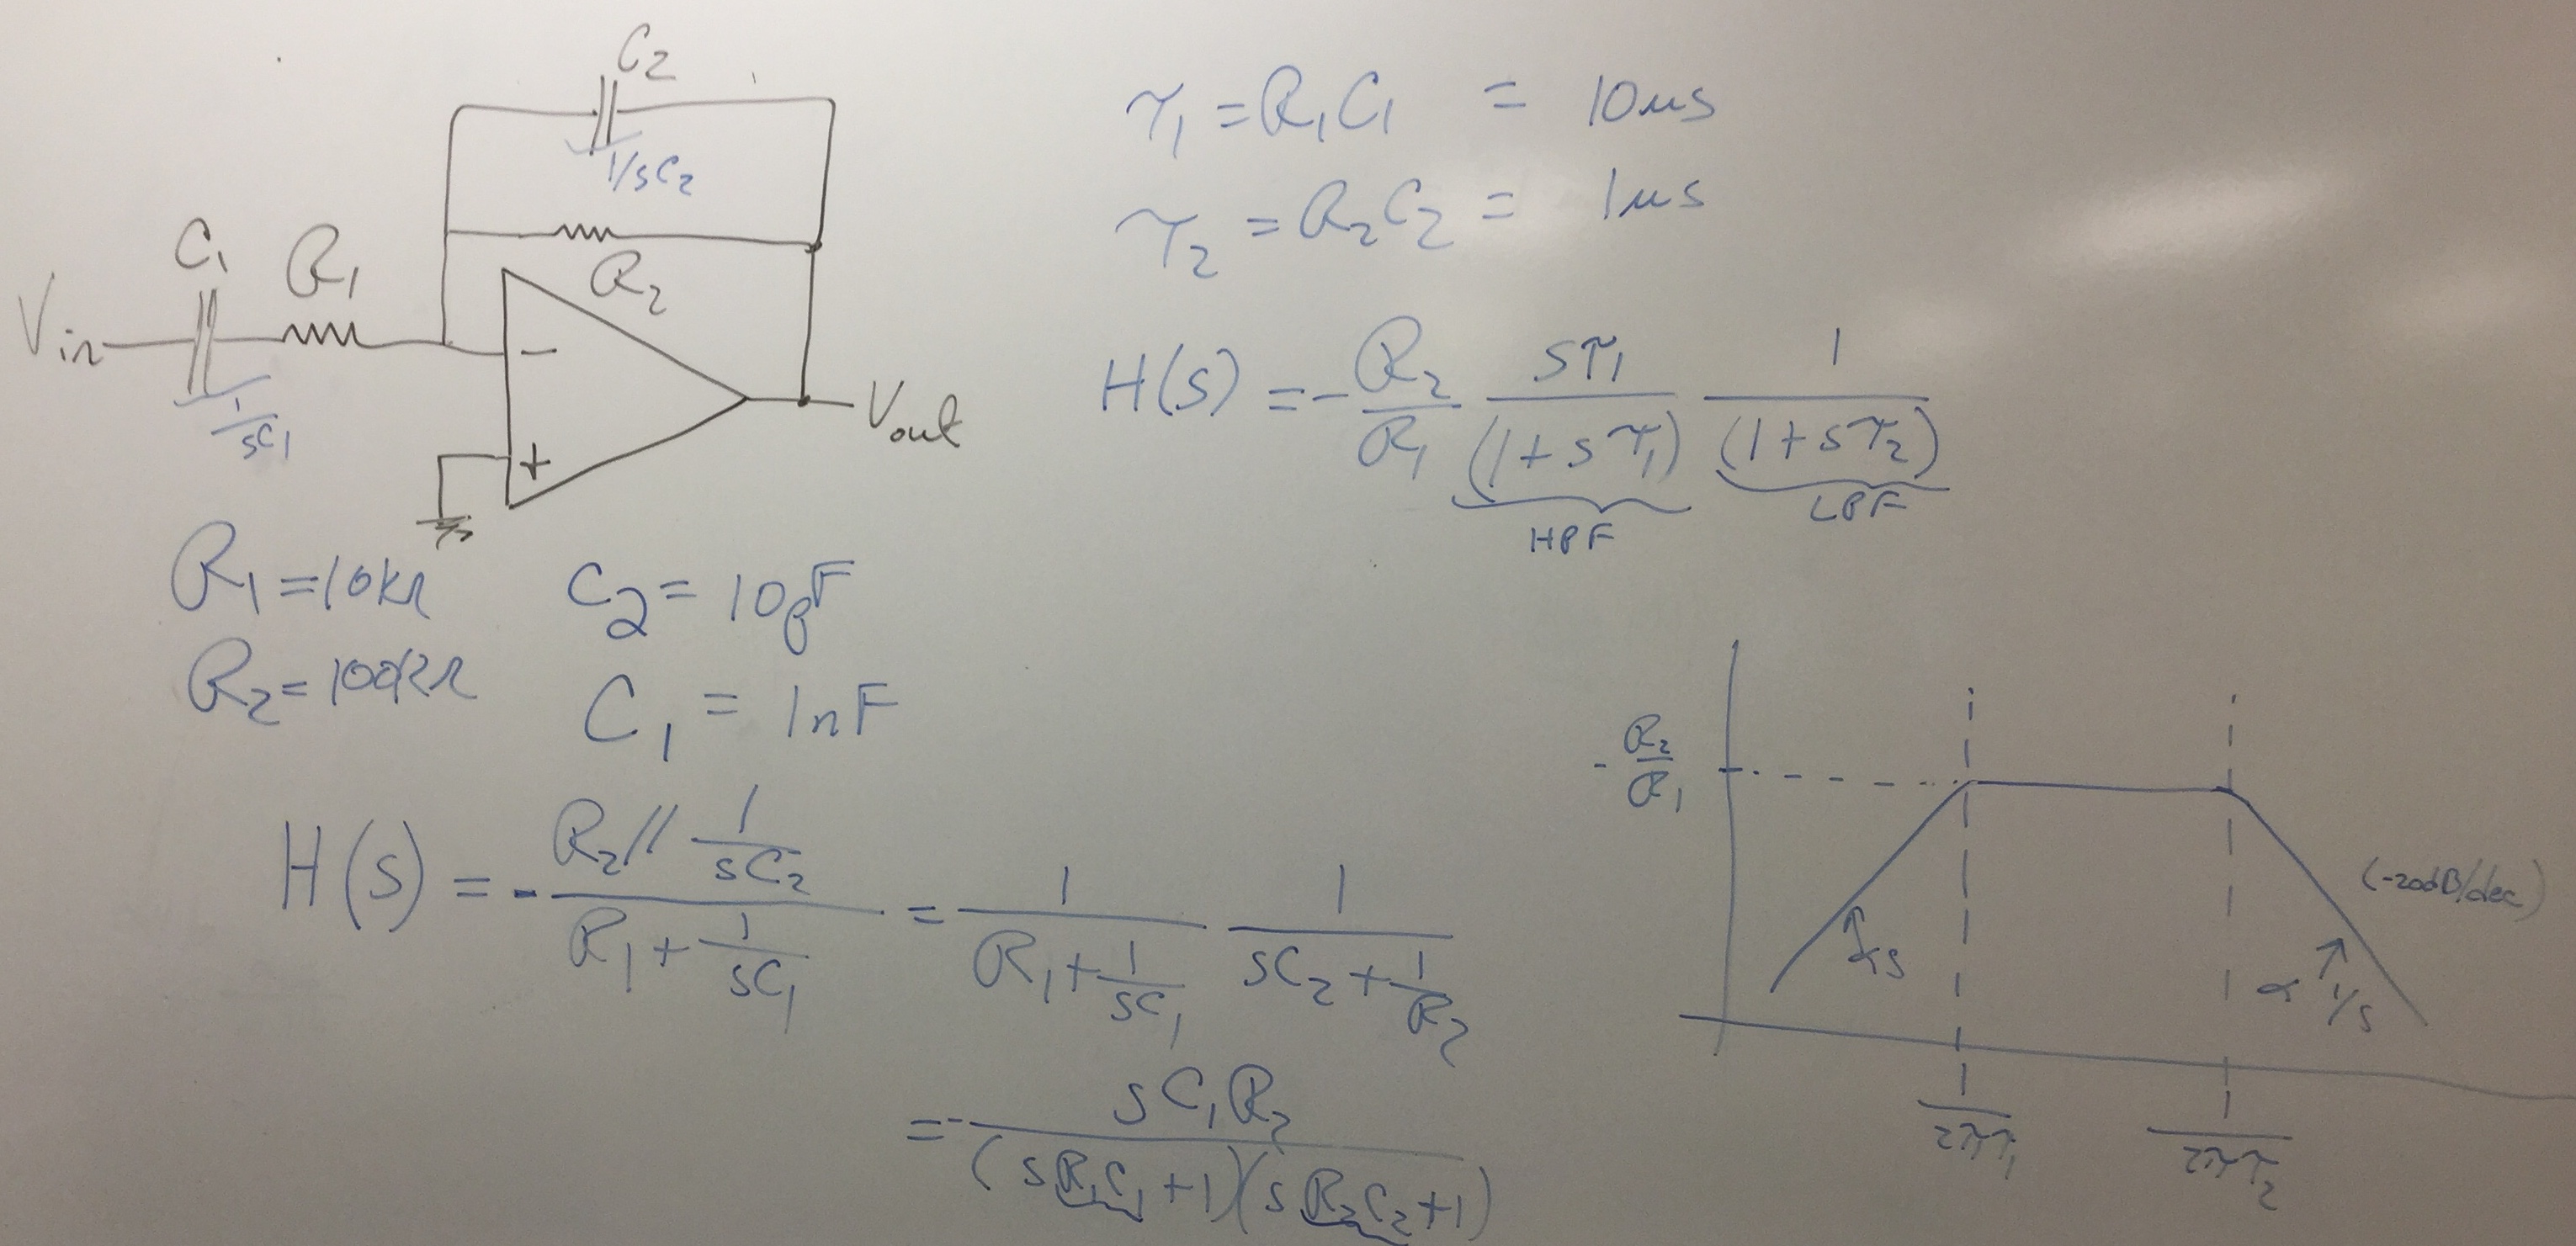
R-C Bandpass Op-Amp,
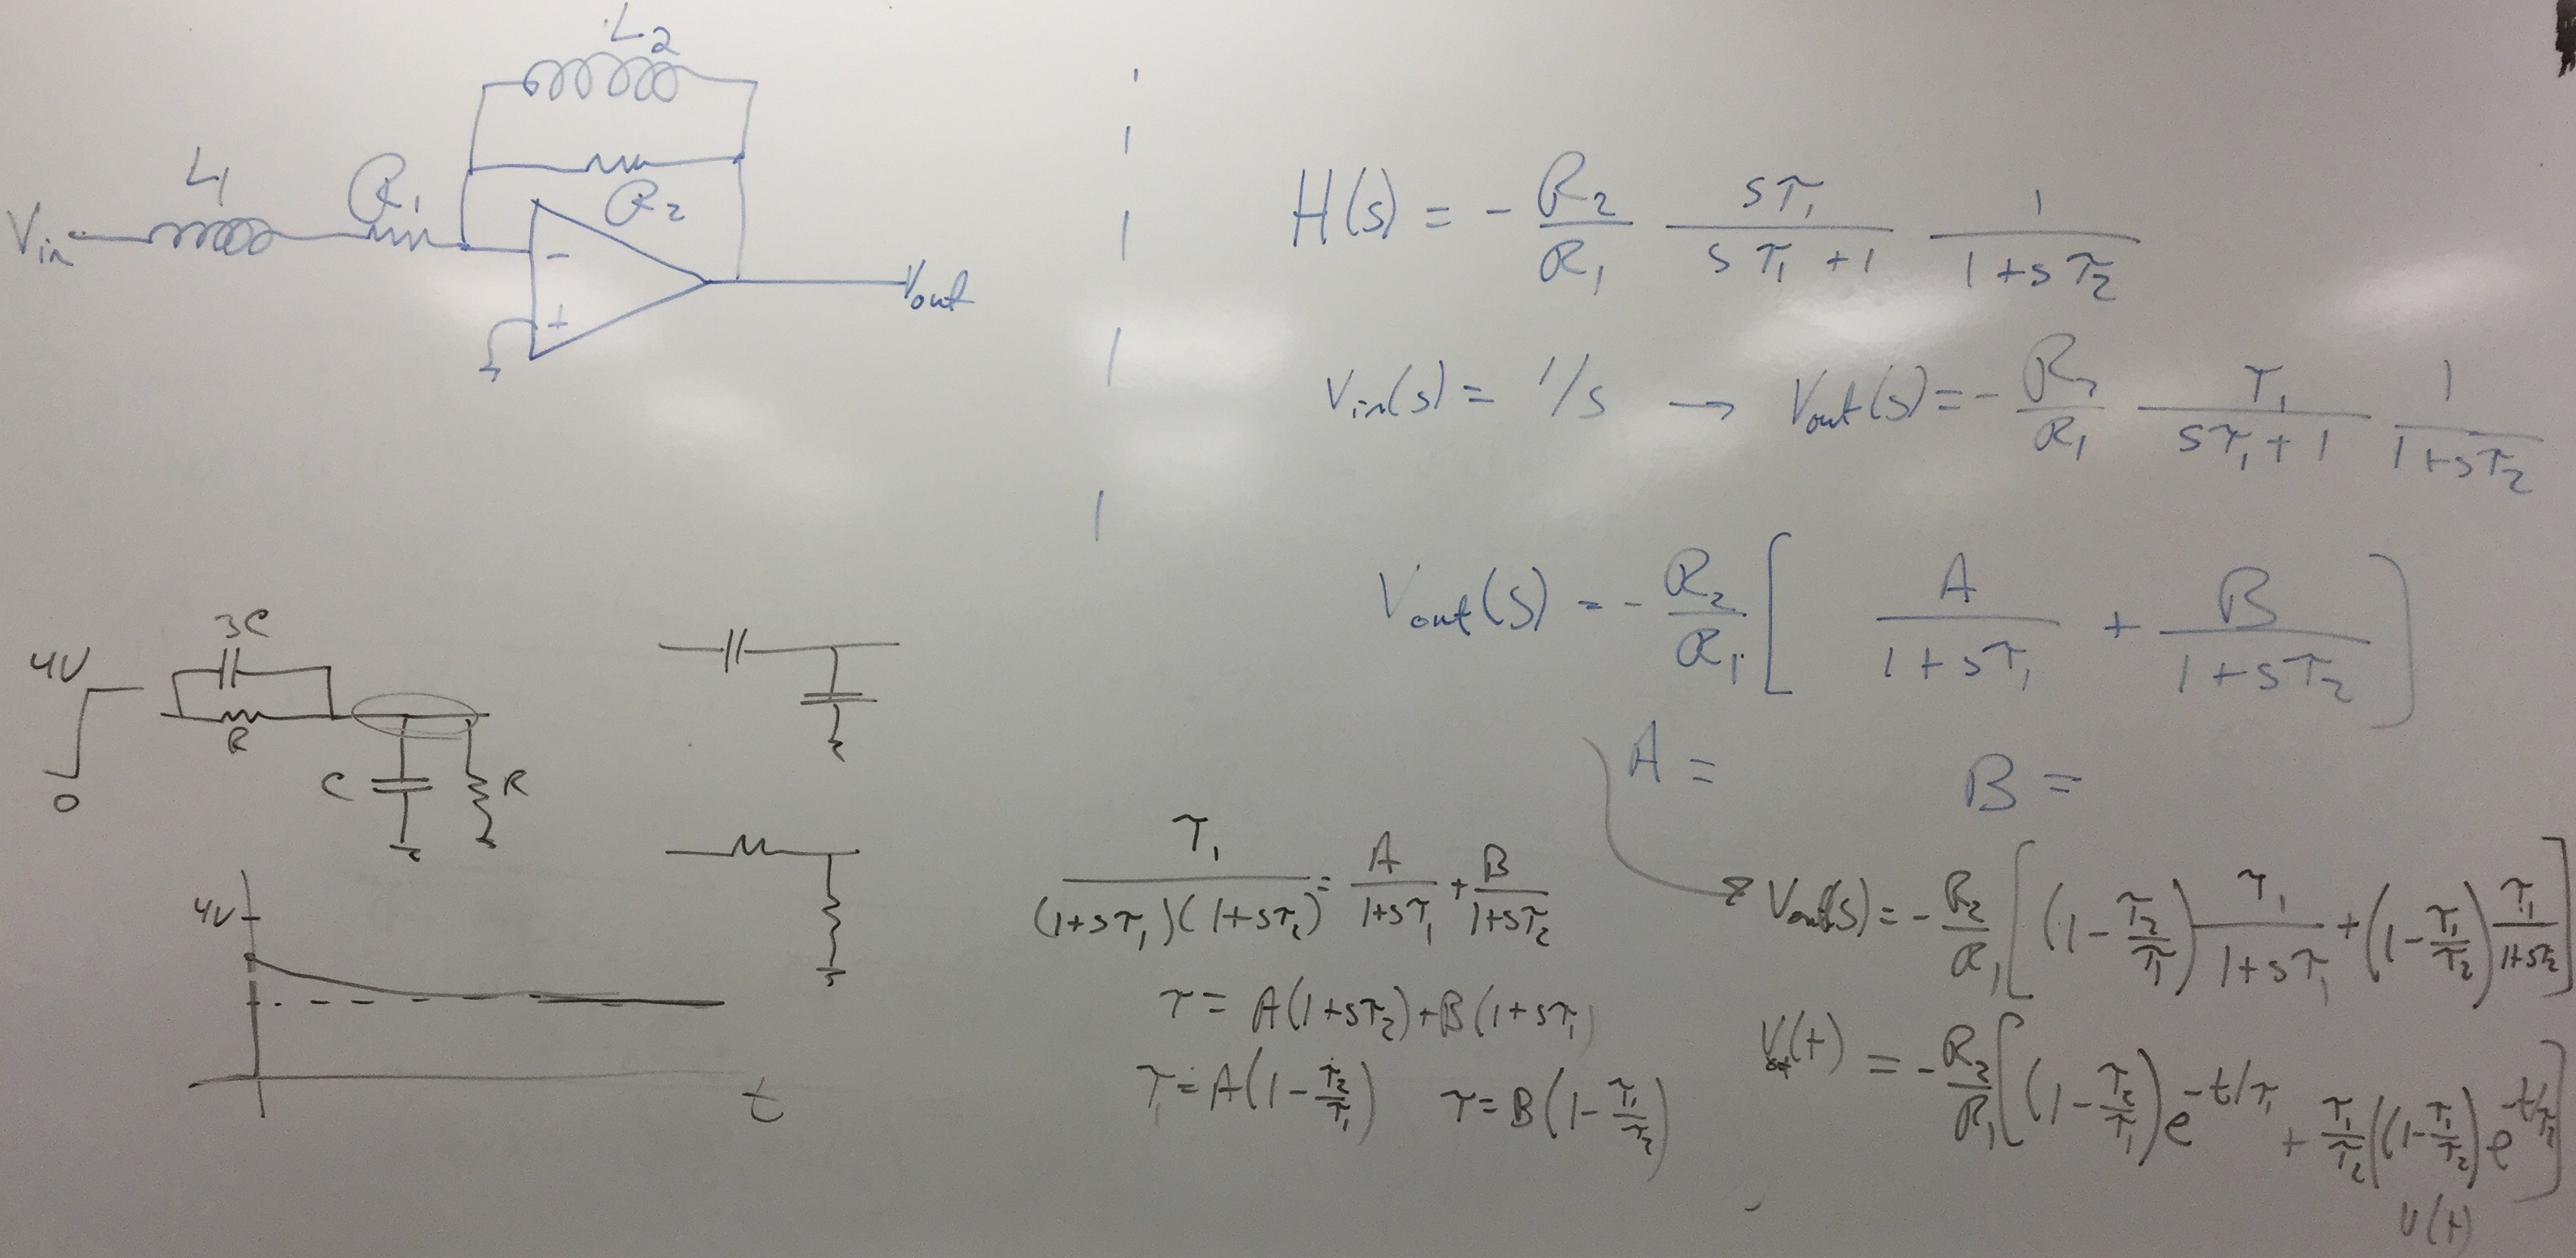
R-L Bandpass Op-Amp,
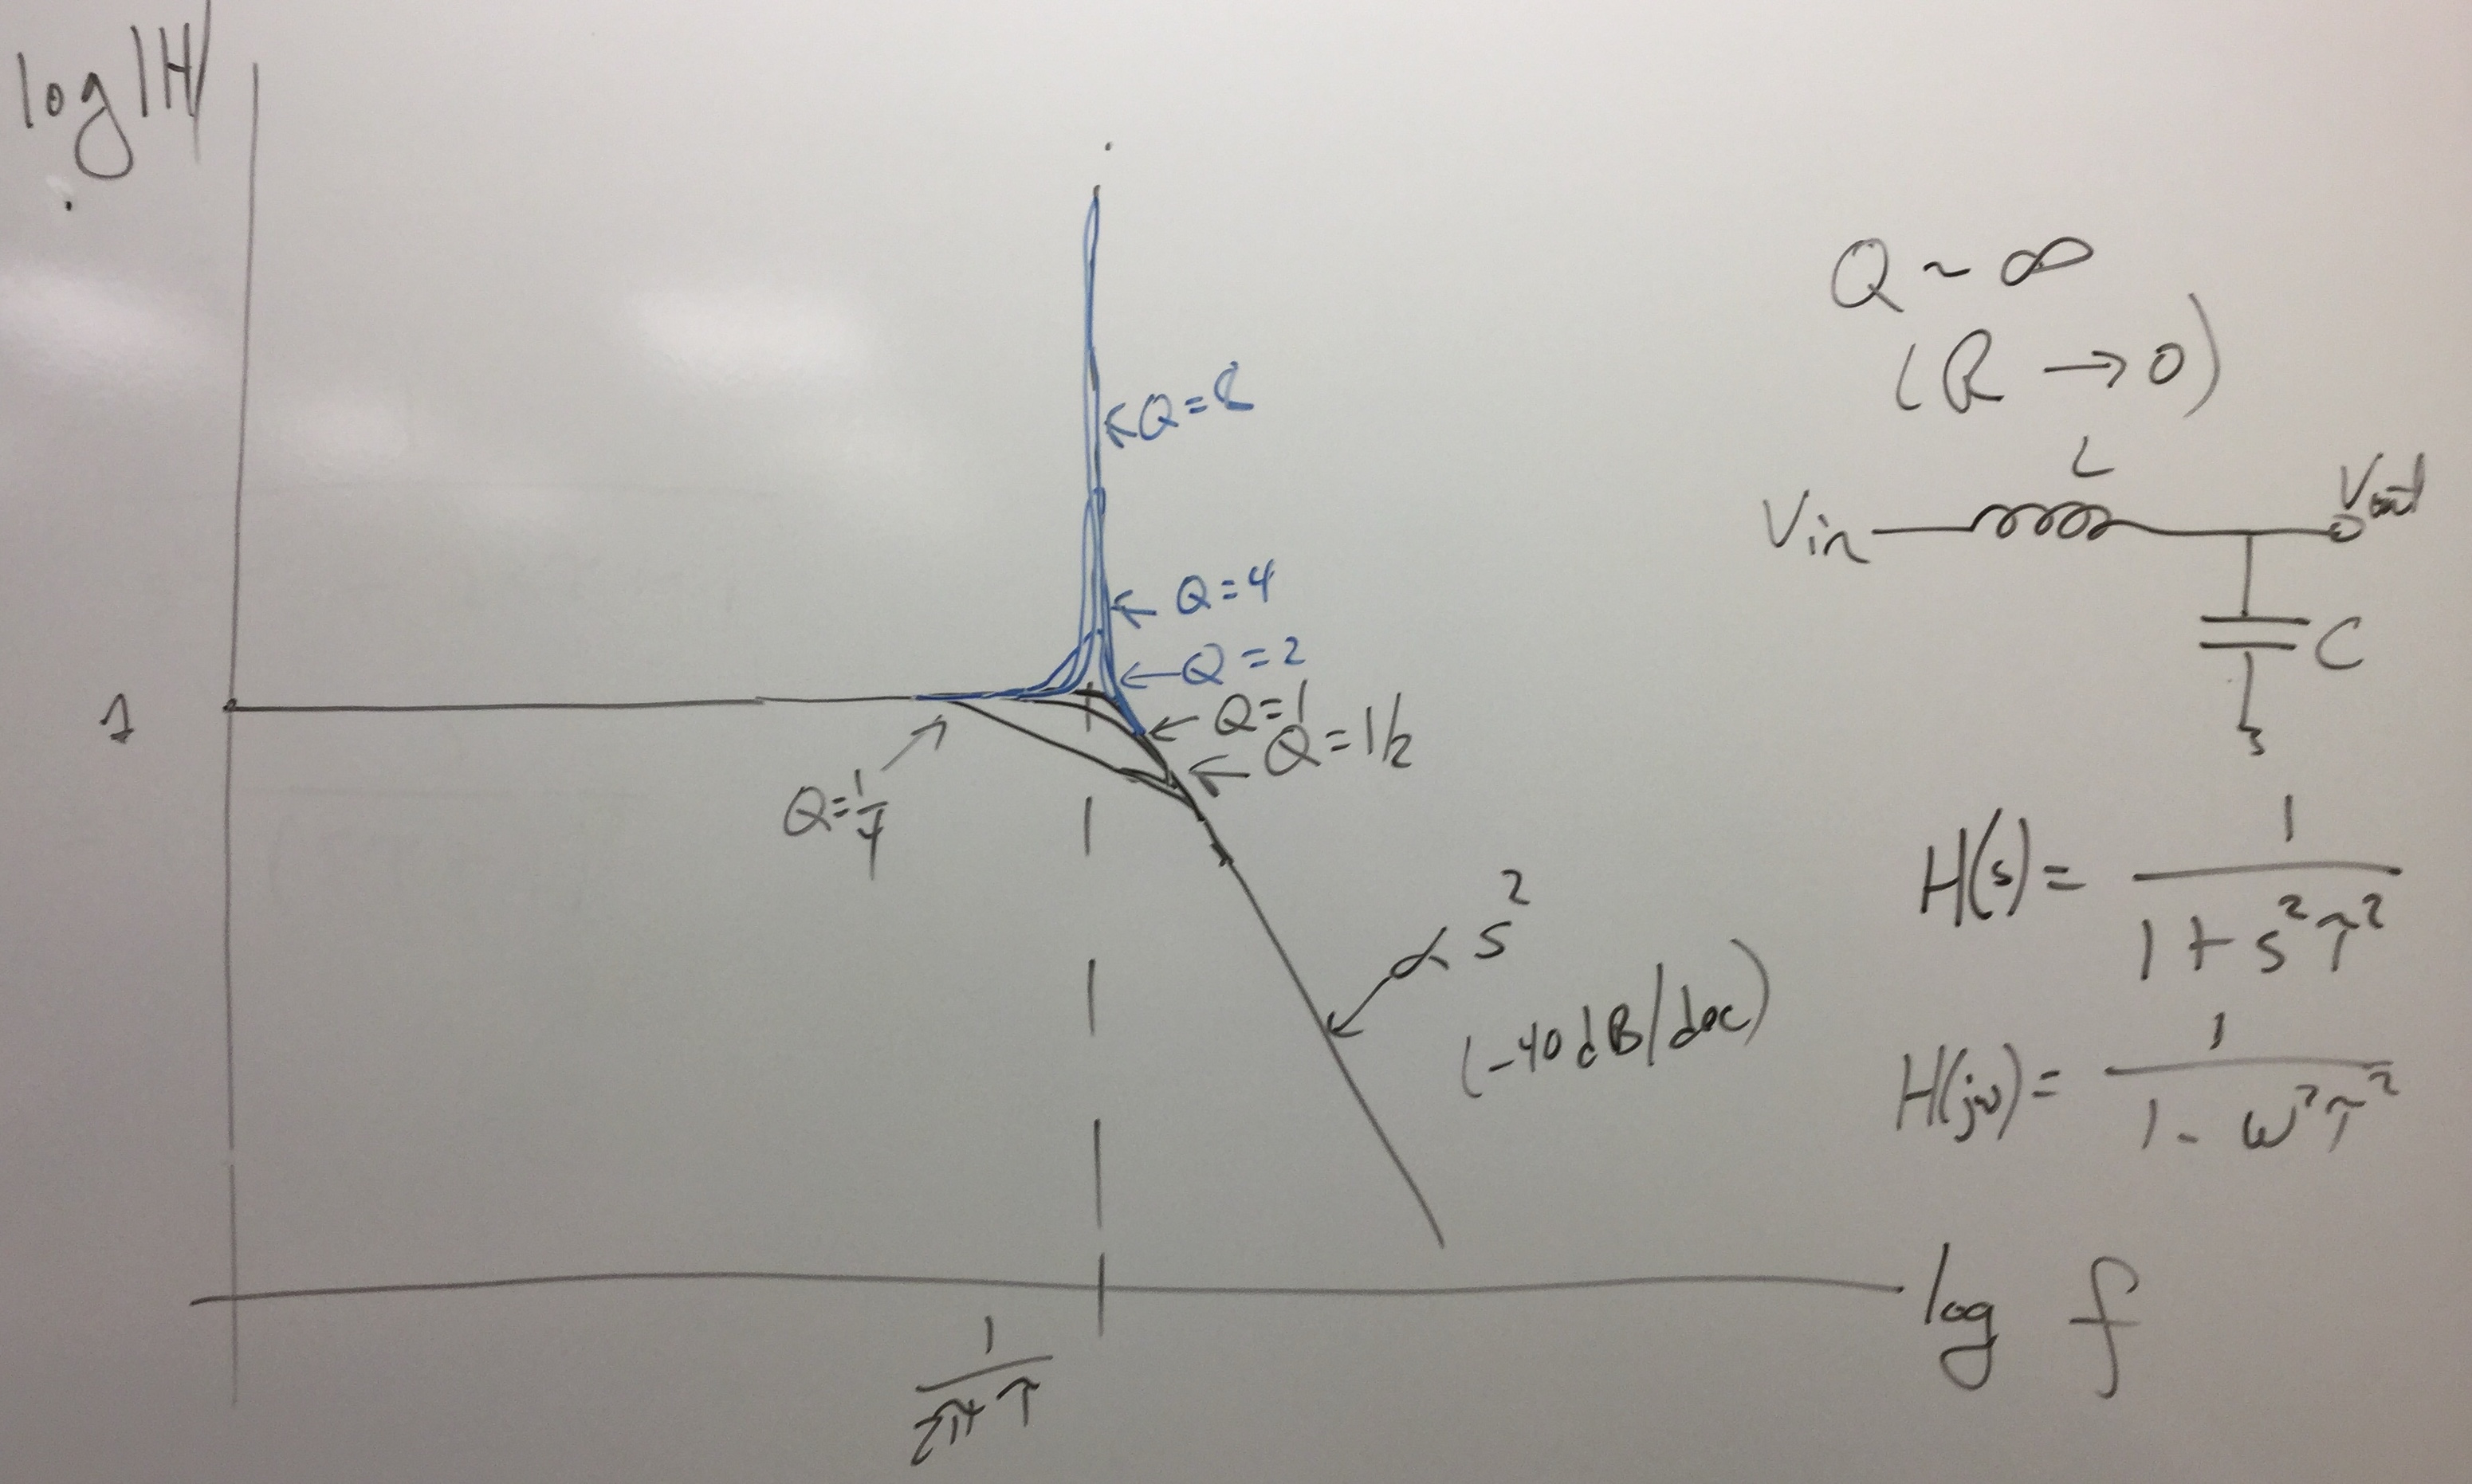
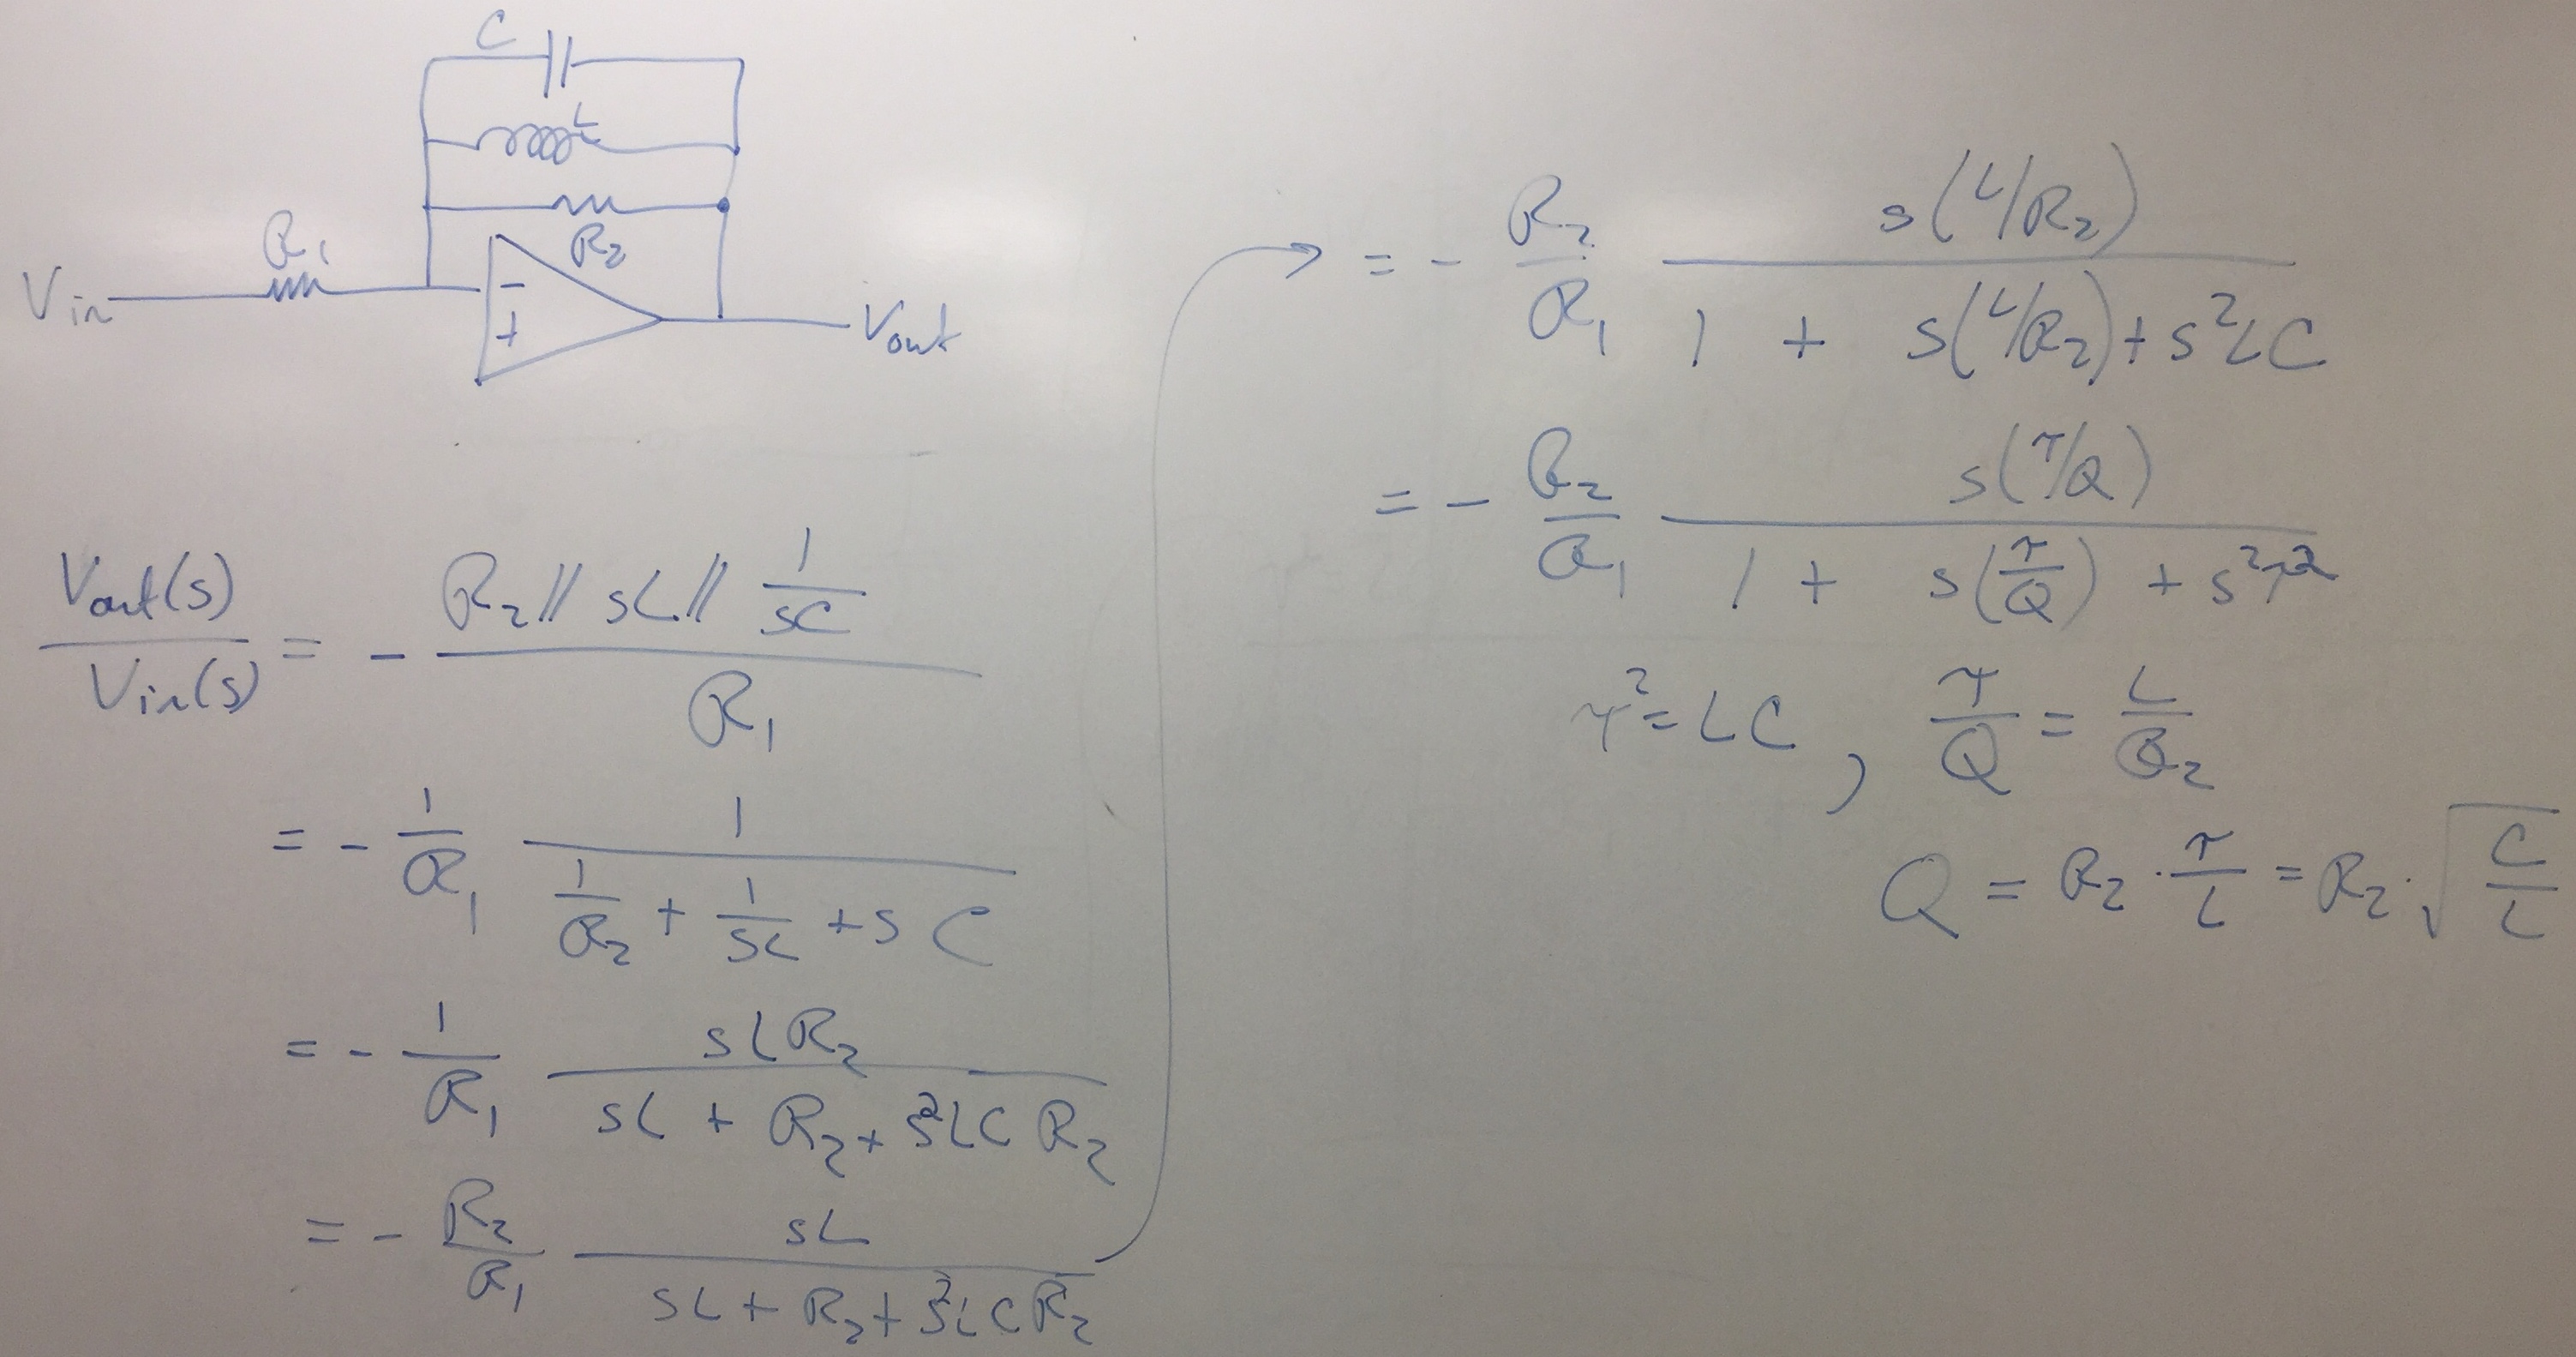
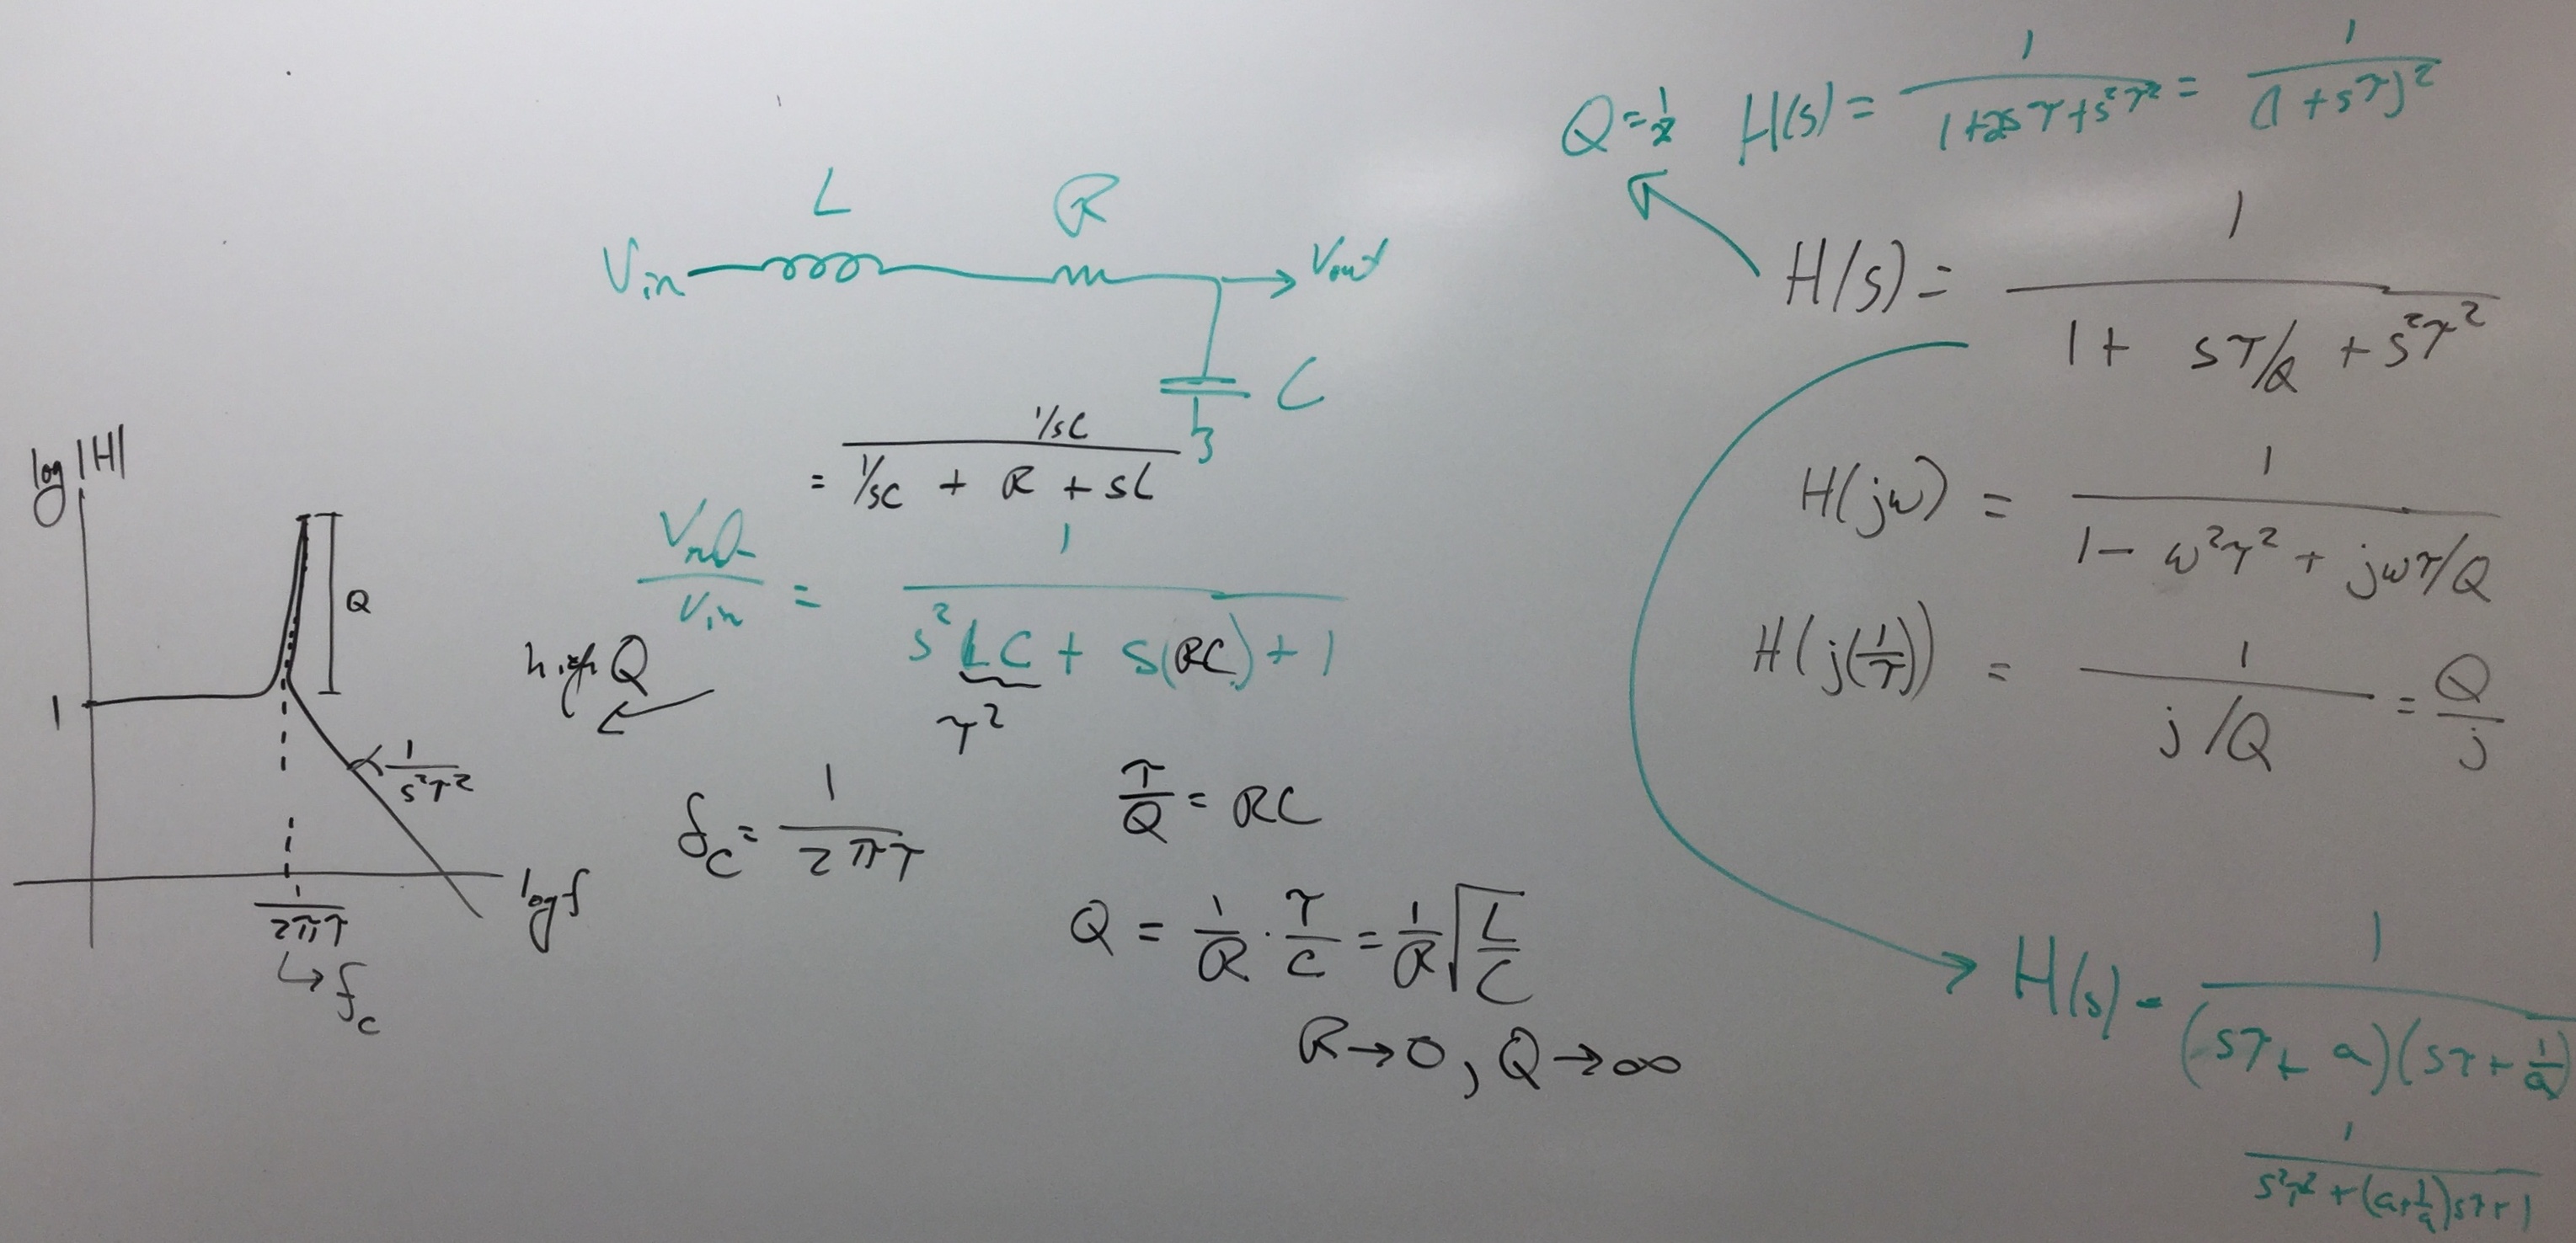
R-L-C Bandpass Op-Amp,
|
1 ,
2 ,
3 ,
4 ,
5 ,
6 ,
7 ,
8 ,
| |
Oct 15
|
Lab Day:
Second-Order
Sections (SOS)
|
SOS
HPF SOS
Work on Lab
before class
|
1 ,
2 ,
| |
Oct 20
|
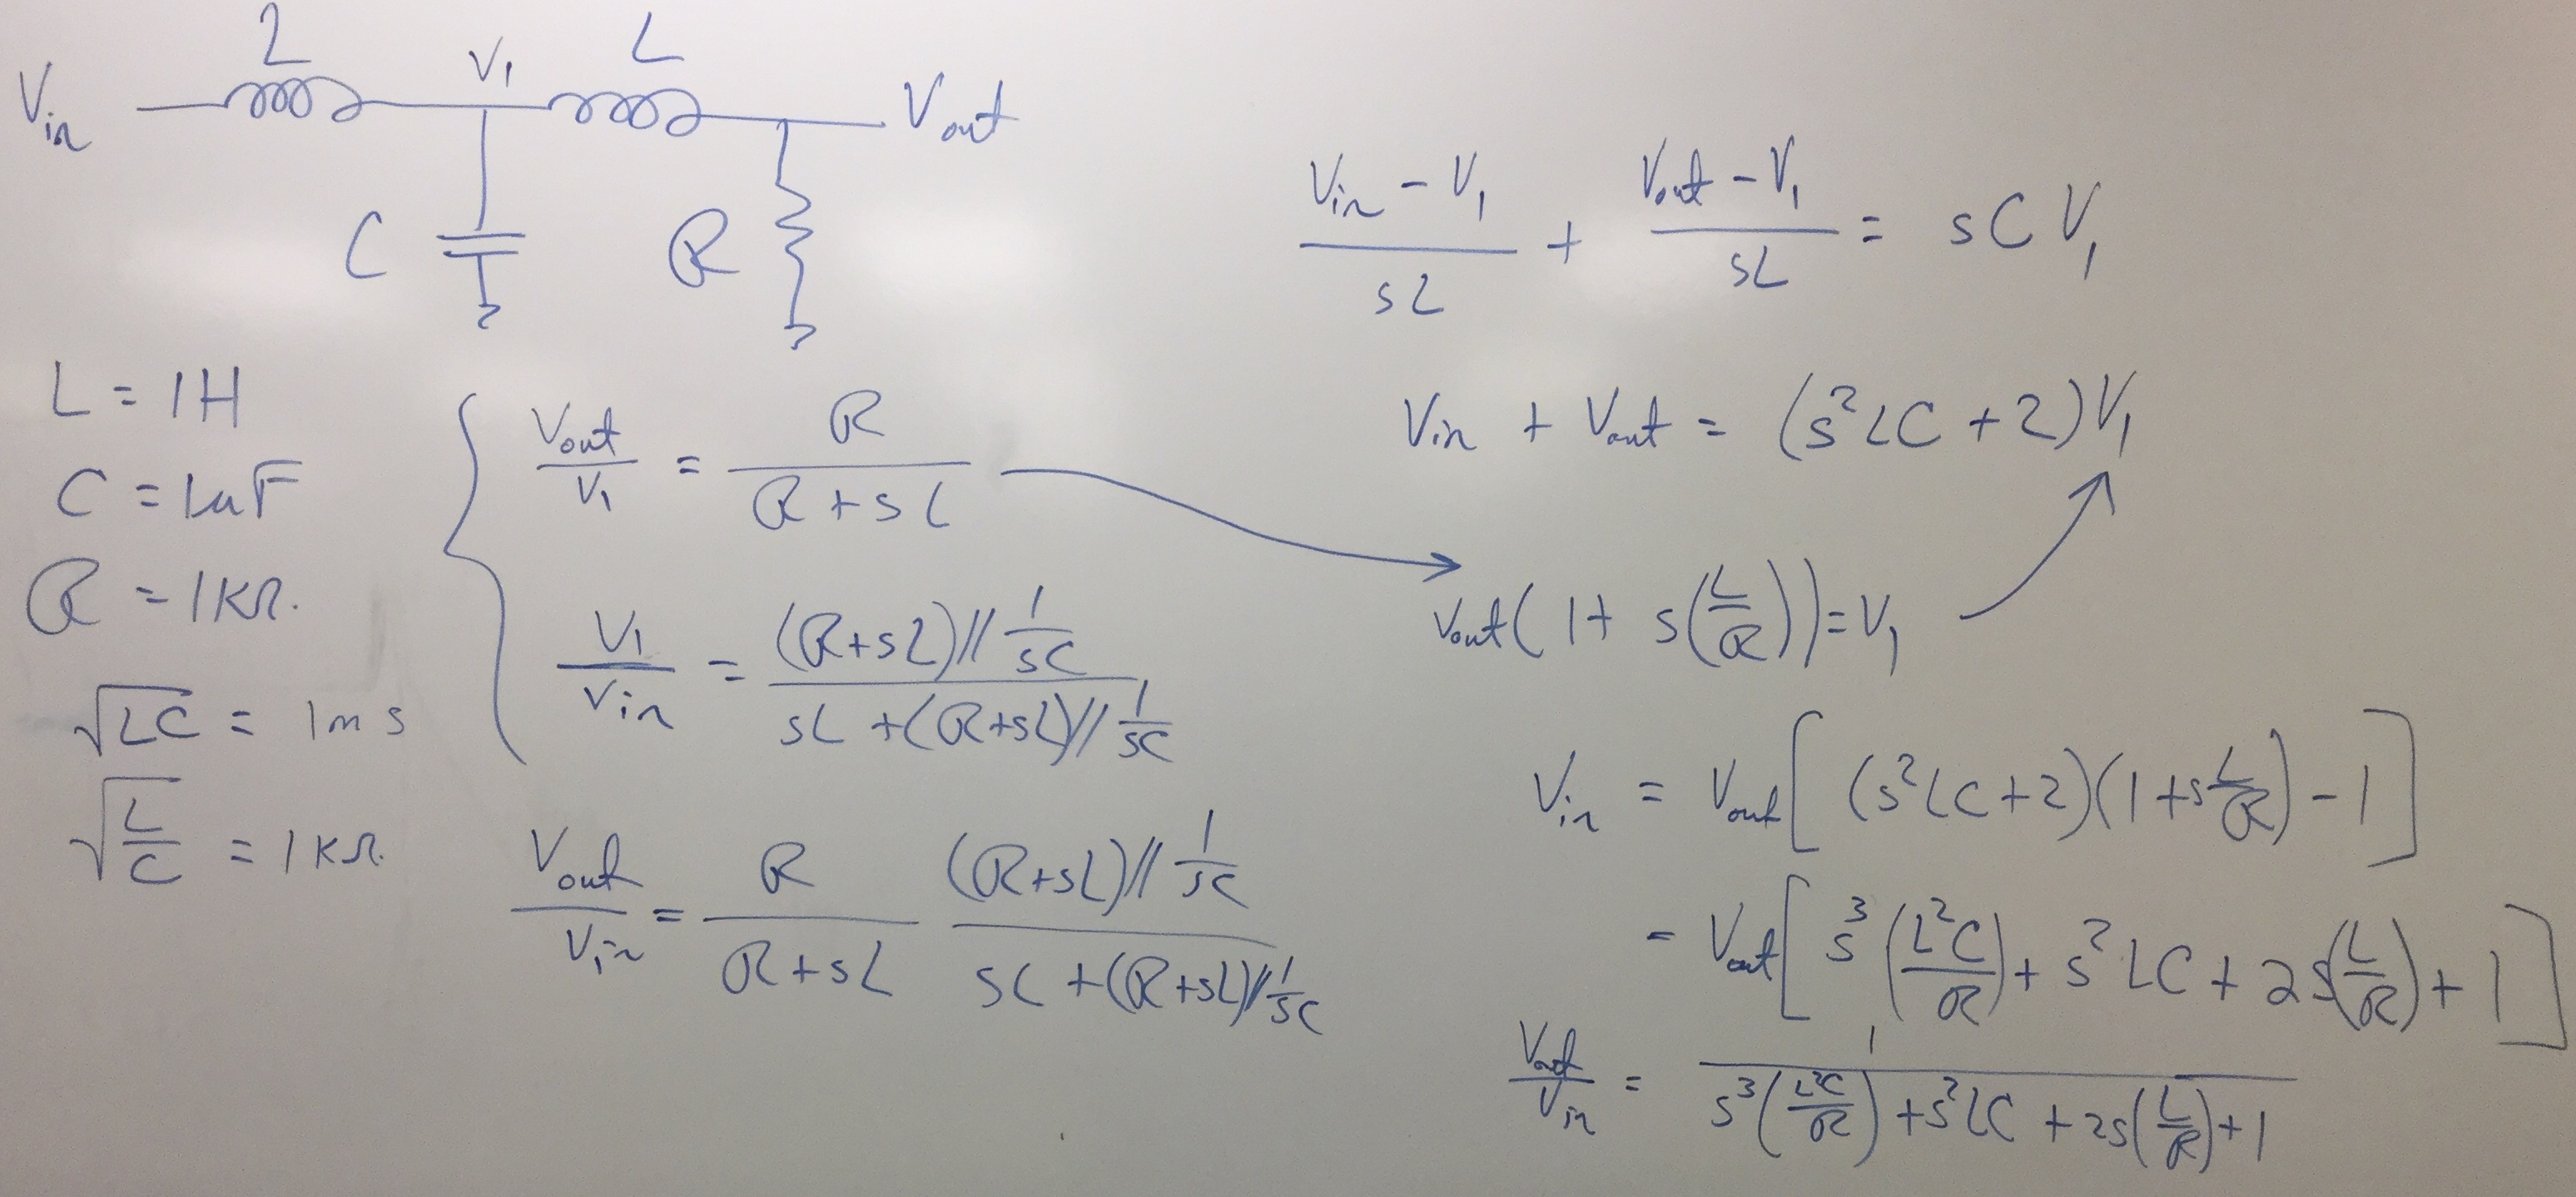
SOS and RLC Circuits
|
Charge Summation,
3rd Order Example,
SOS LPF example,
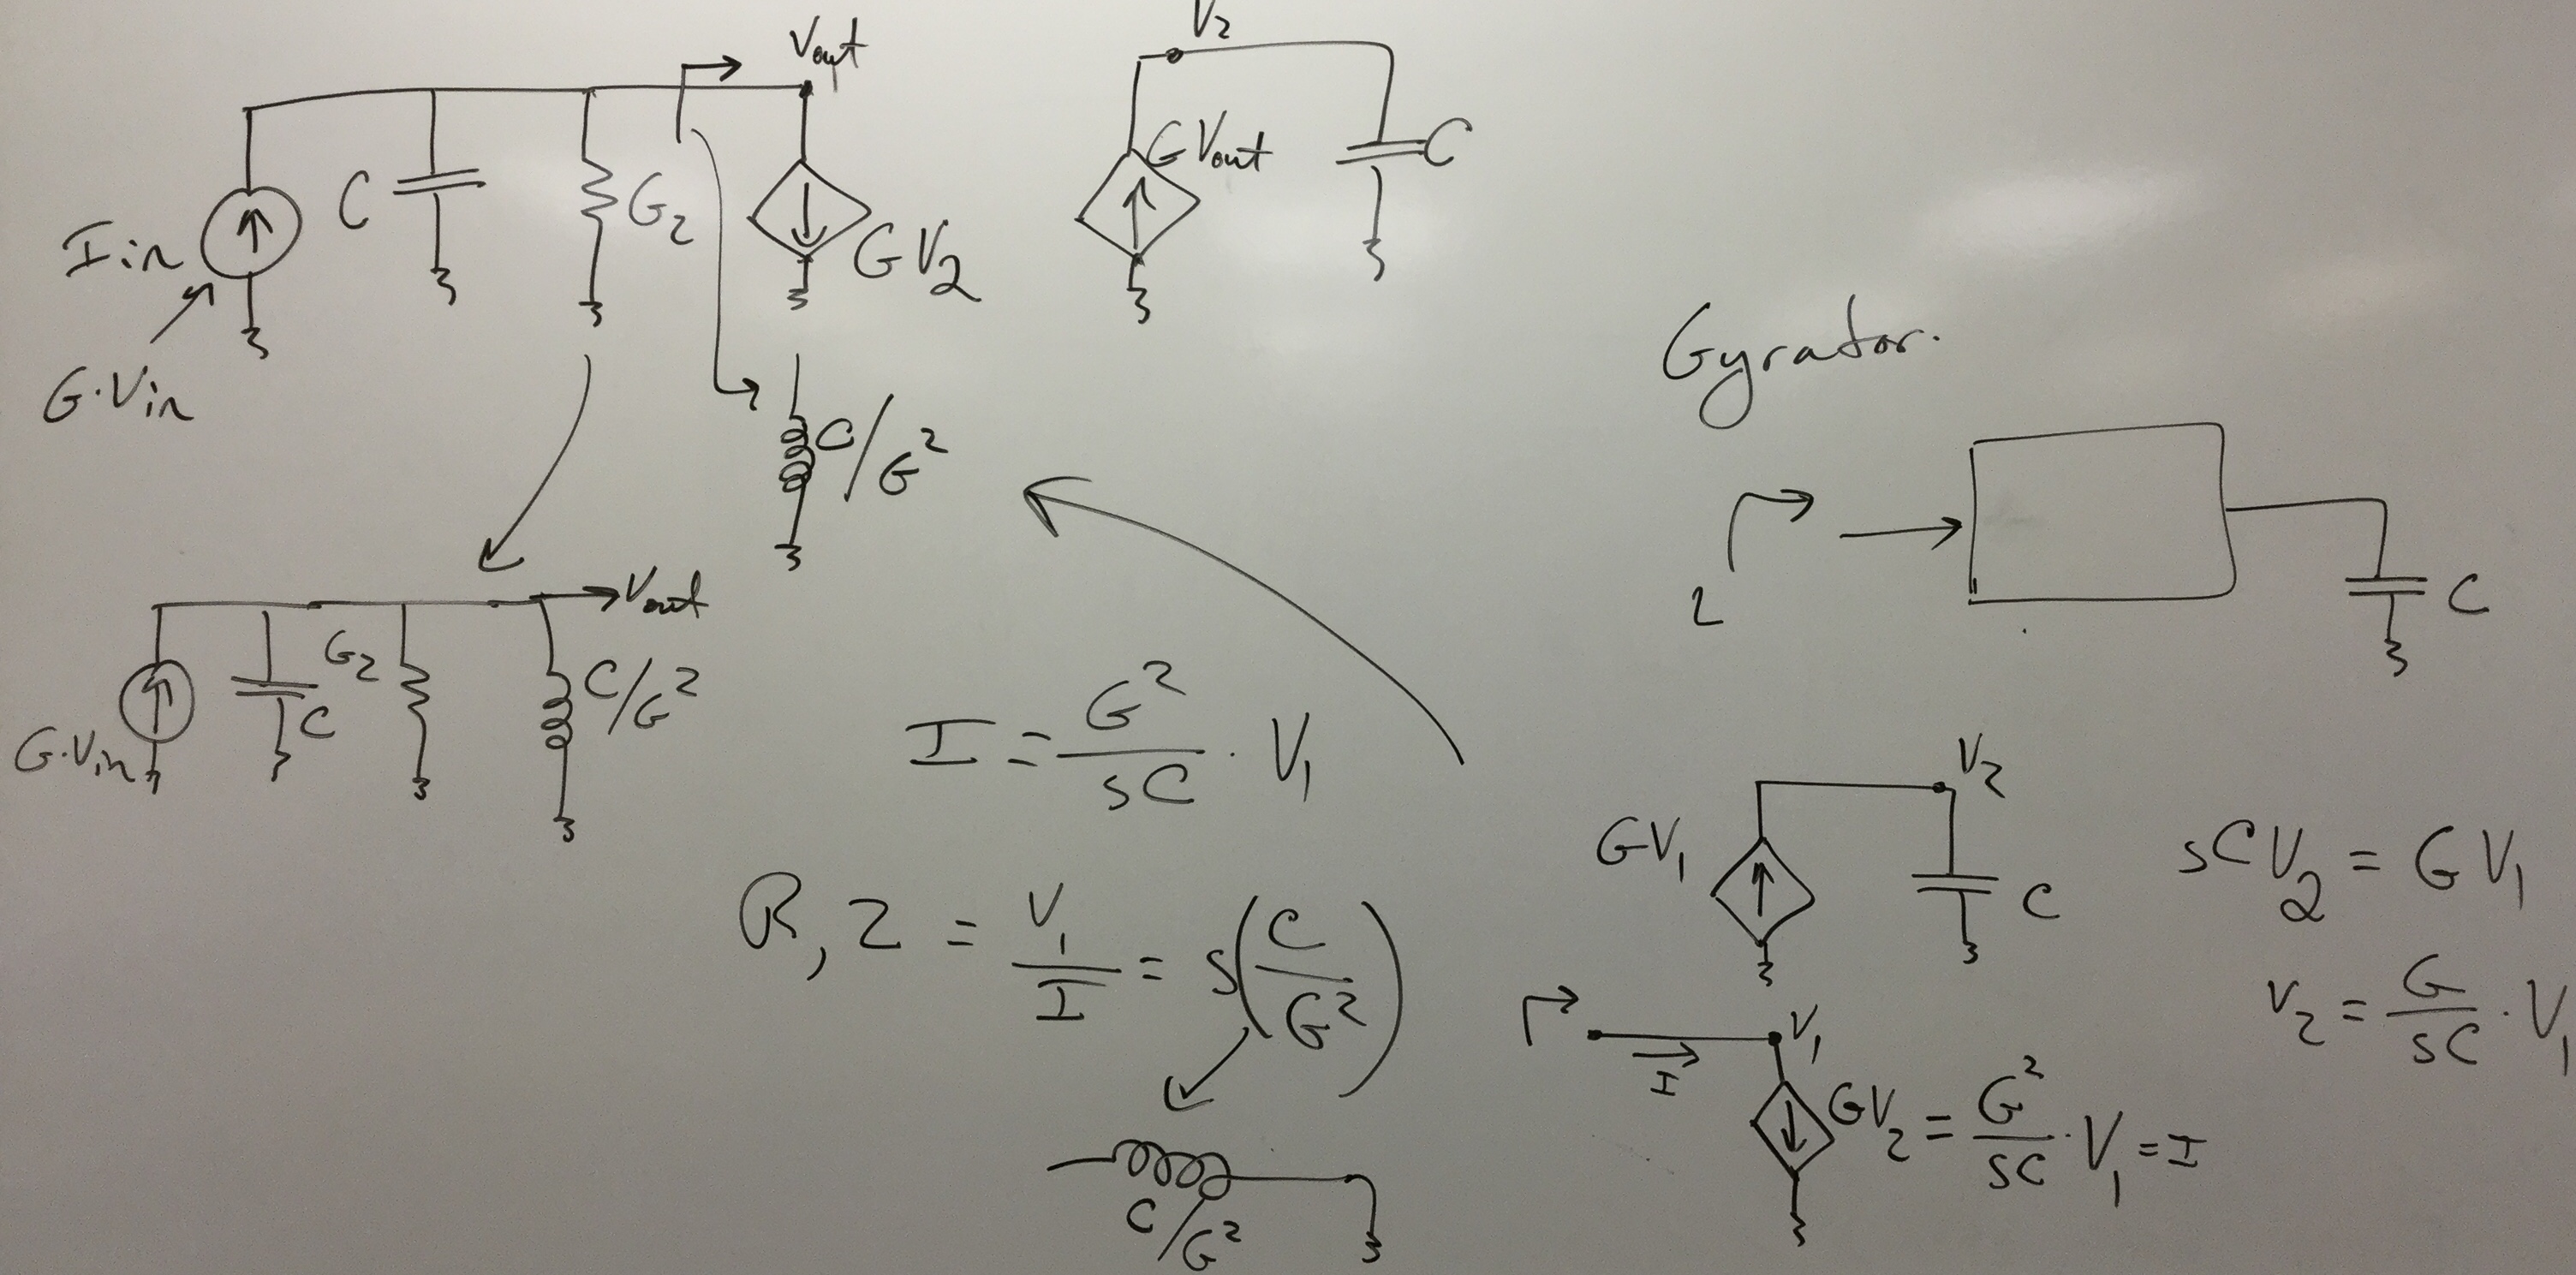
Gyrator Circuit example
|
1 ,
2 ,
3 ,
4 ,
| |
Oct 22
|
Op-Amp based Filters
|
Overview Filter Concepts,
Newsome 2nd Order Circuit,
Rauch 2nd Order Circuit,
|
1 ,
2 ,
3 ,
4 ,
| |
Oct 27
|
Single Sinusoid Circuits
|
Sinusoids & Linear Circuits,
Single Freq Linear Circuits,
|
1 ,
2 ,
3 ,
4 ,
5 ,
6 ,
7 ,
8 ,
9 ,
10 ,
| |
Oct 29
|
Unit Review
|
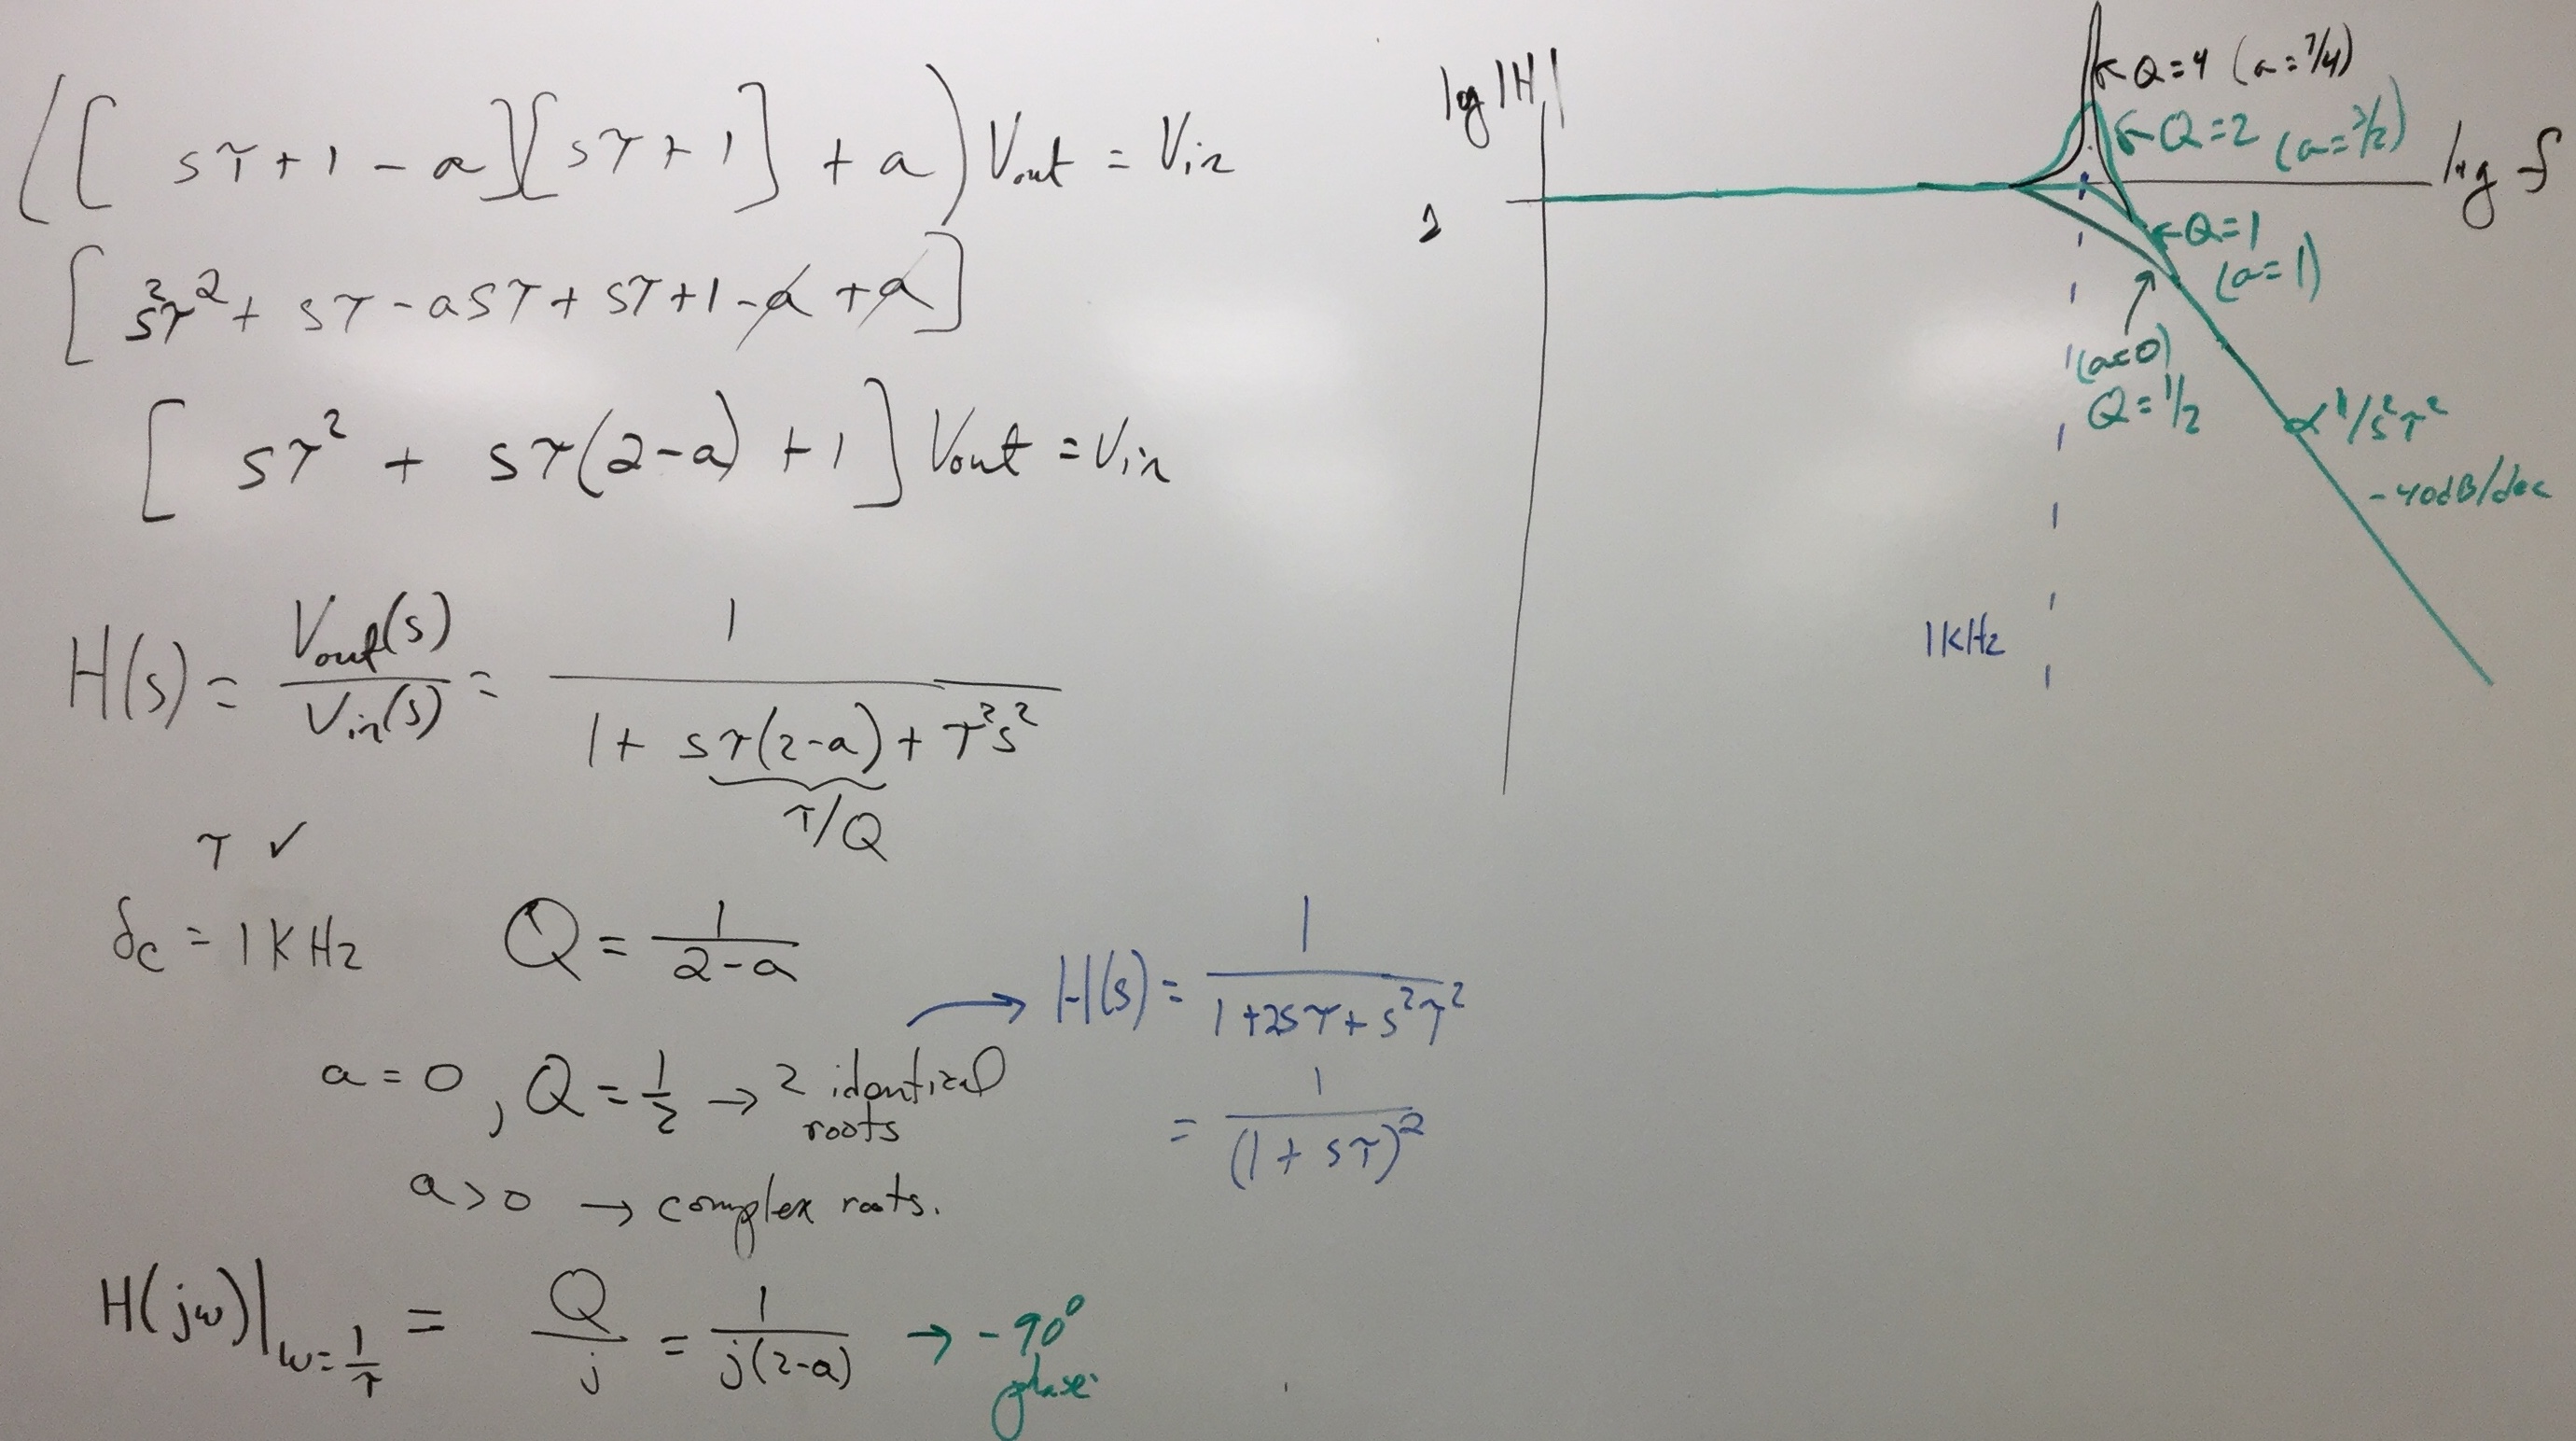
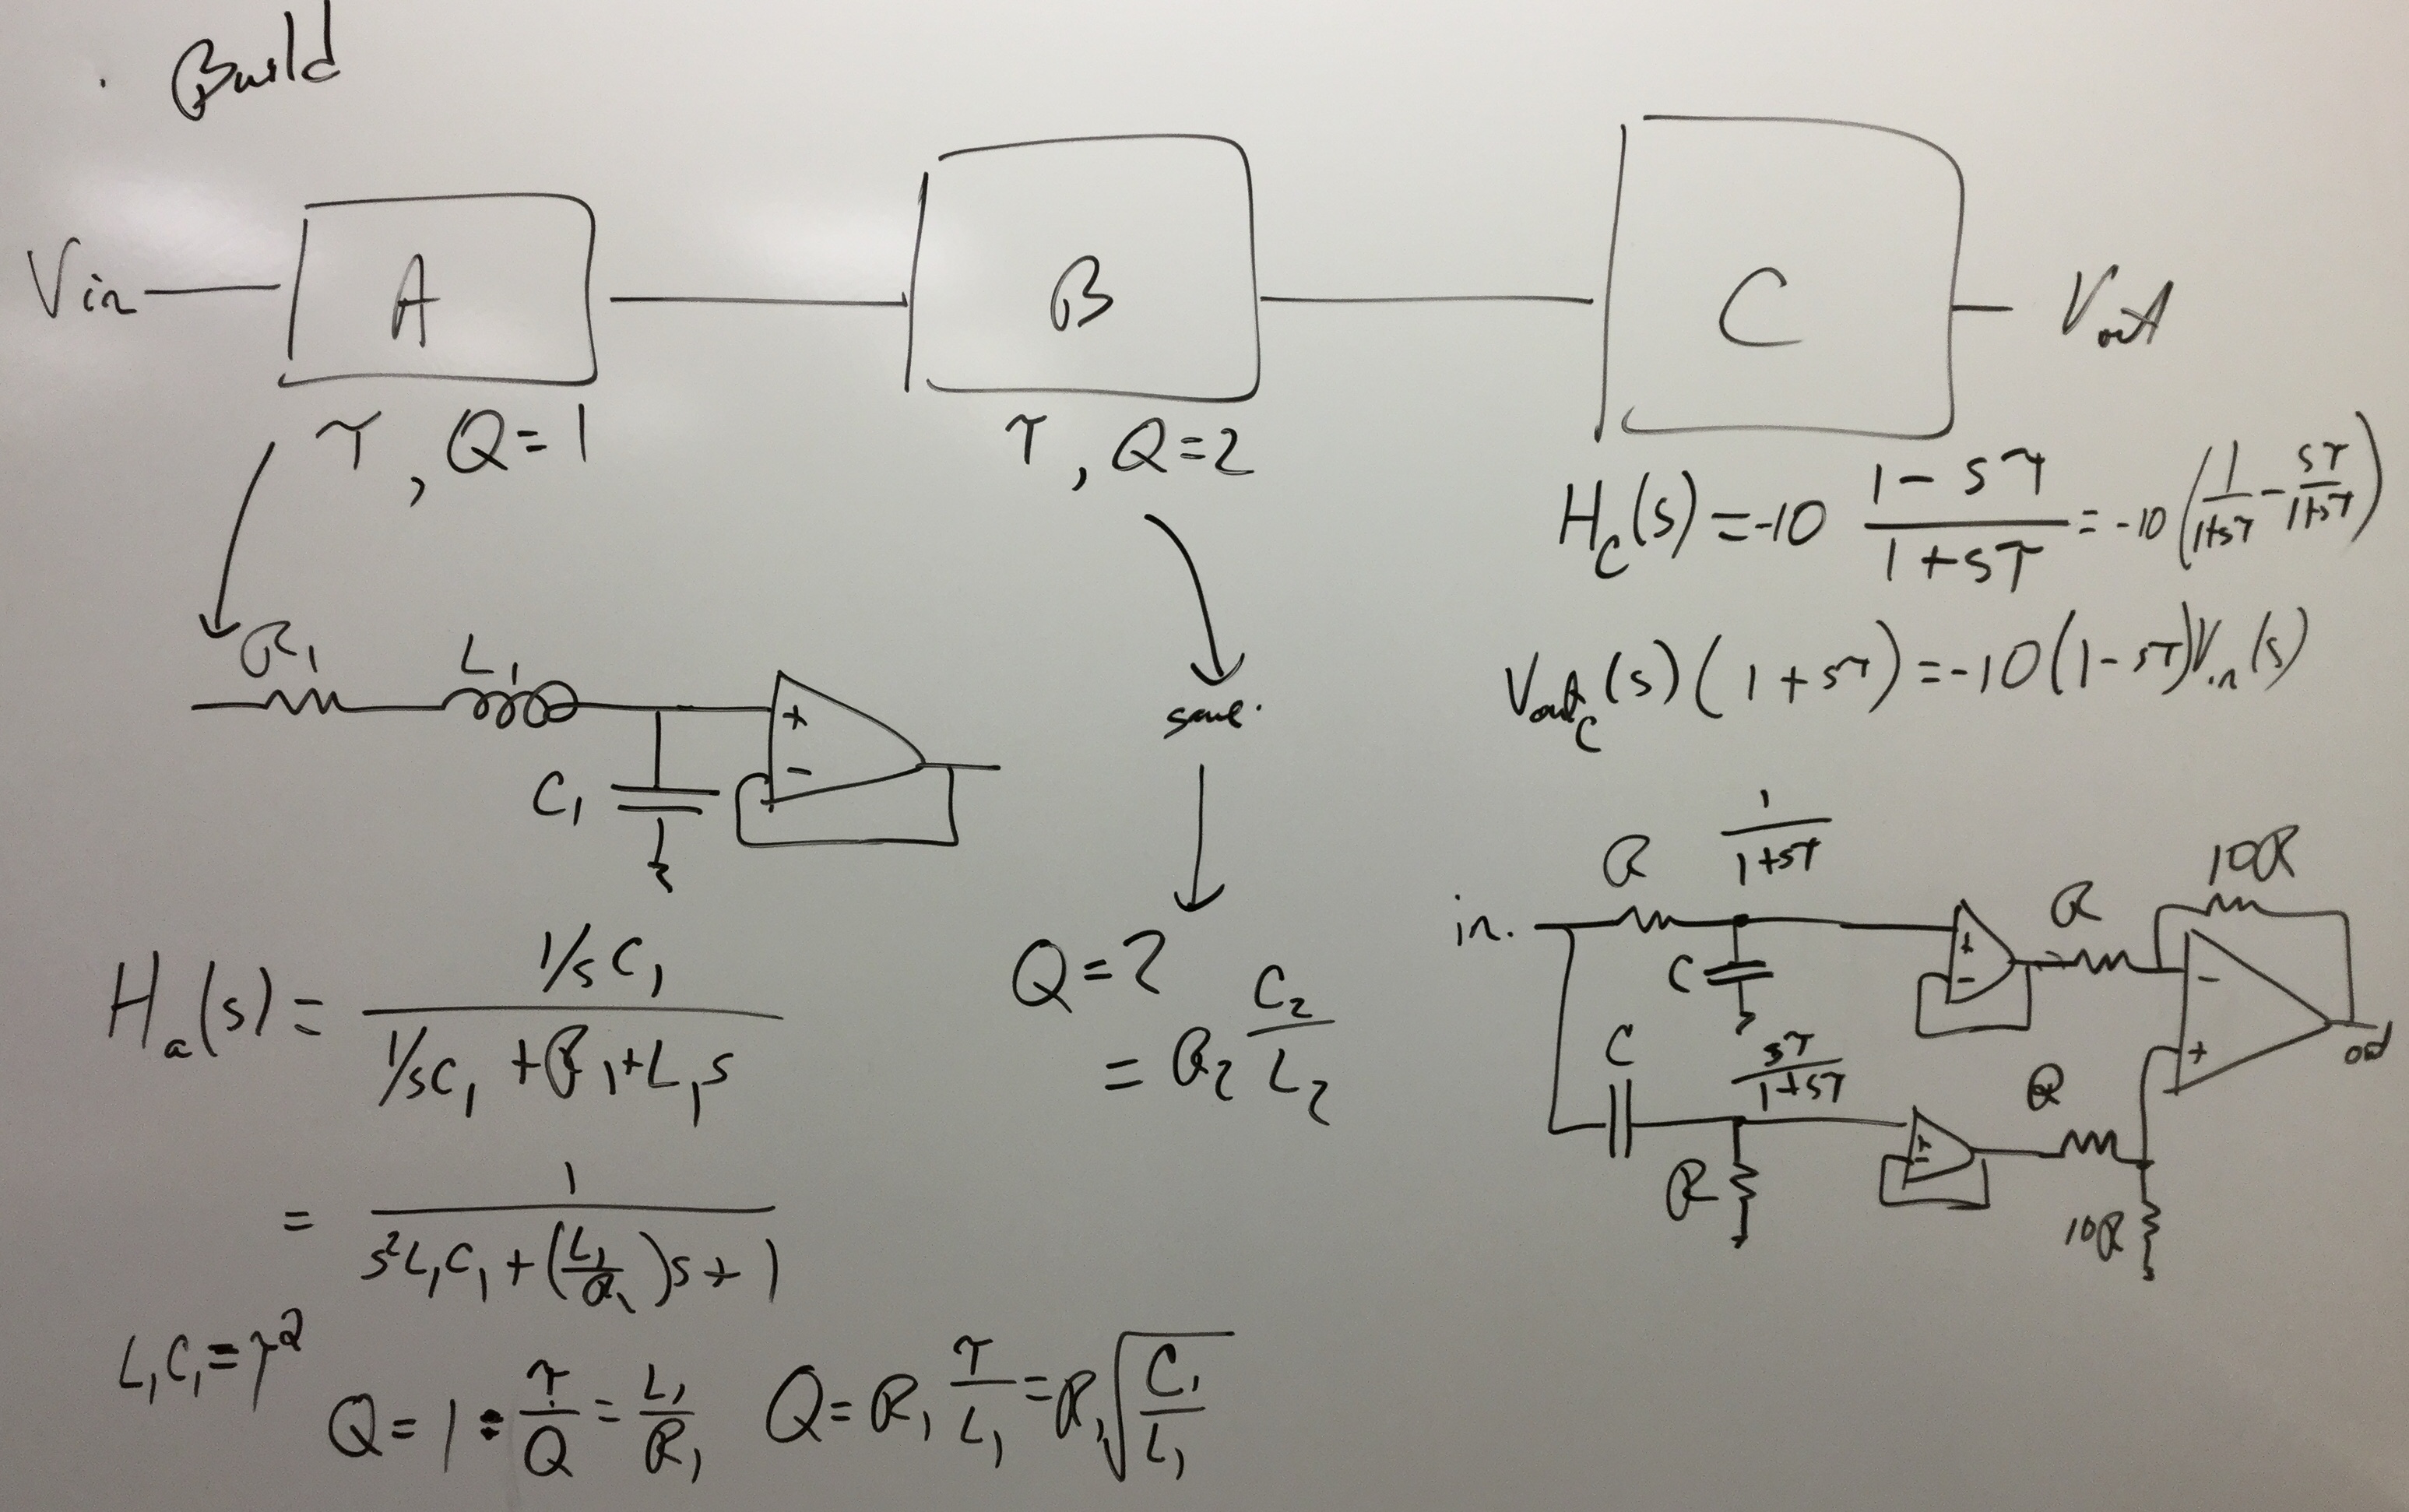
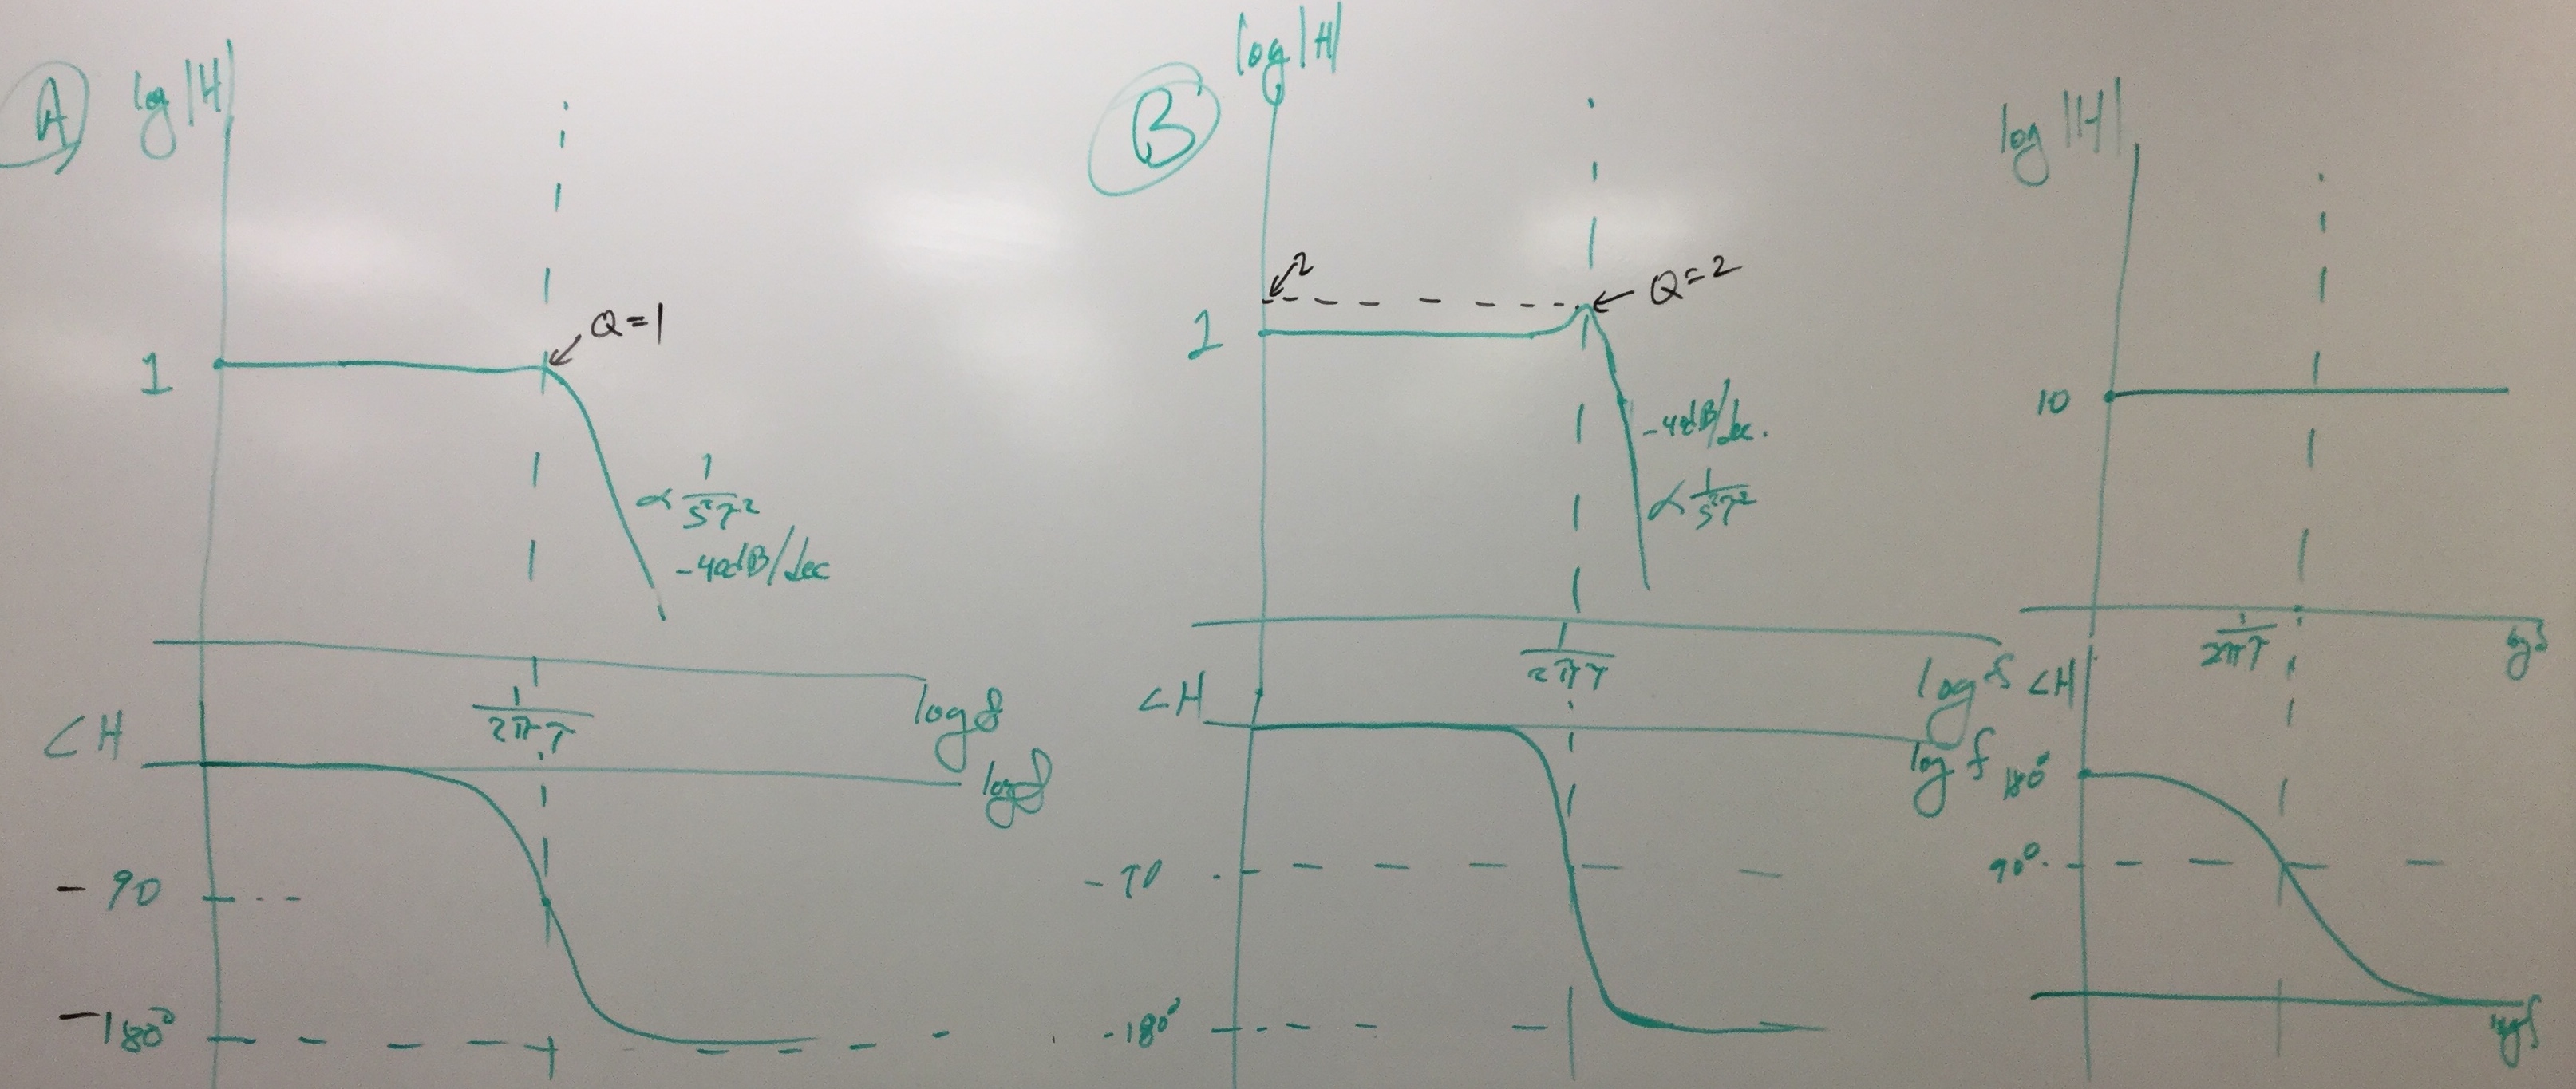
Sallen-Key LPF SOS,
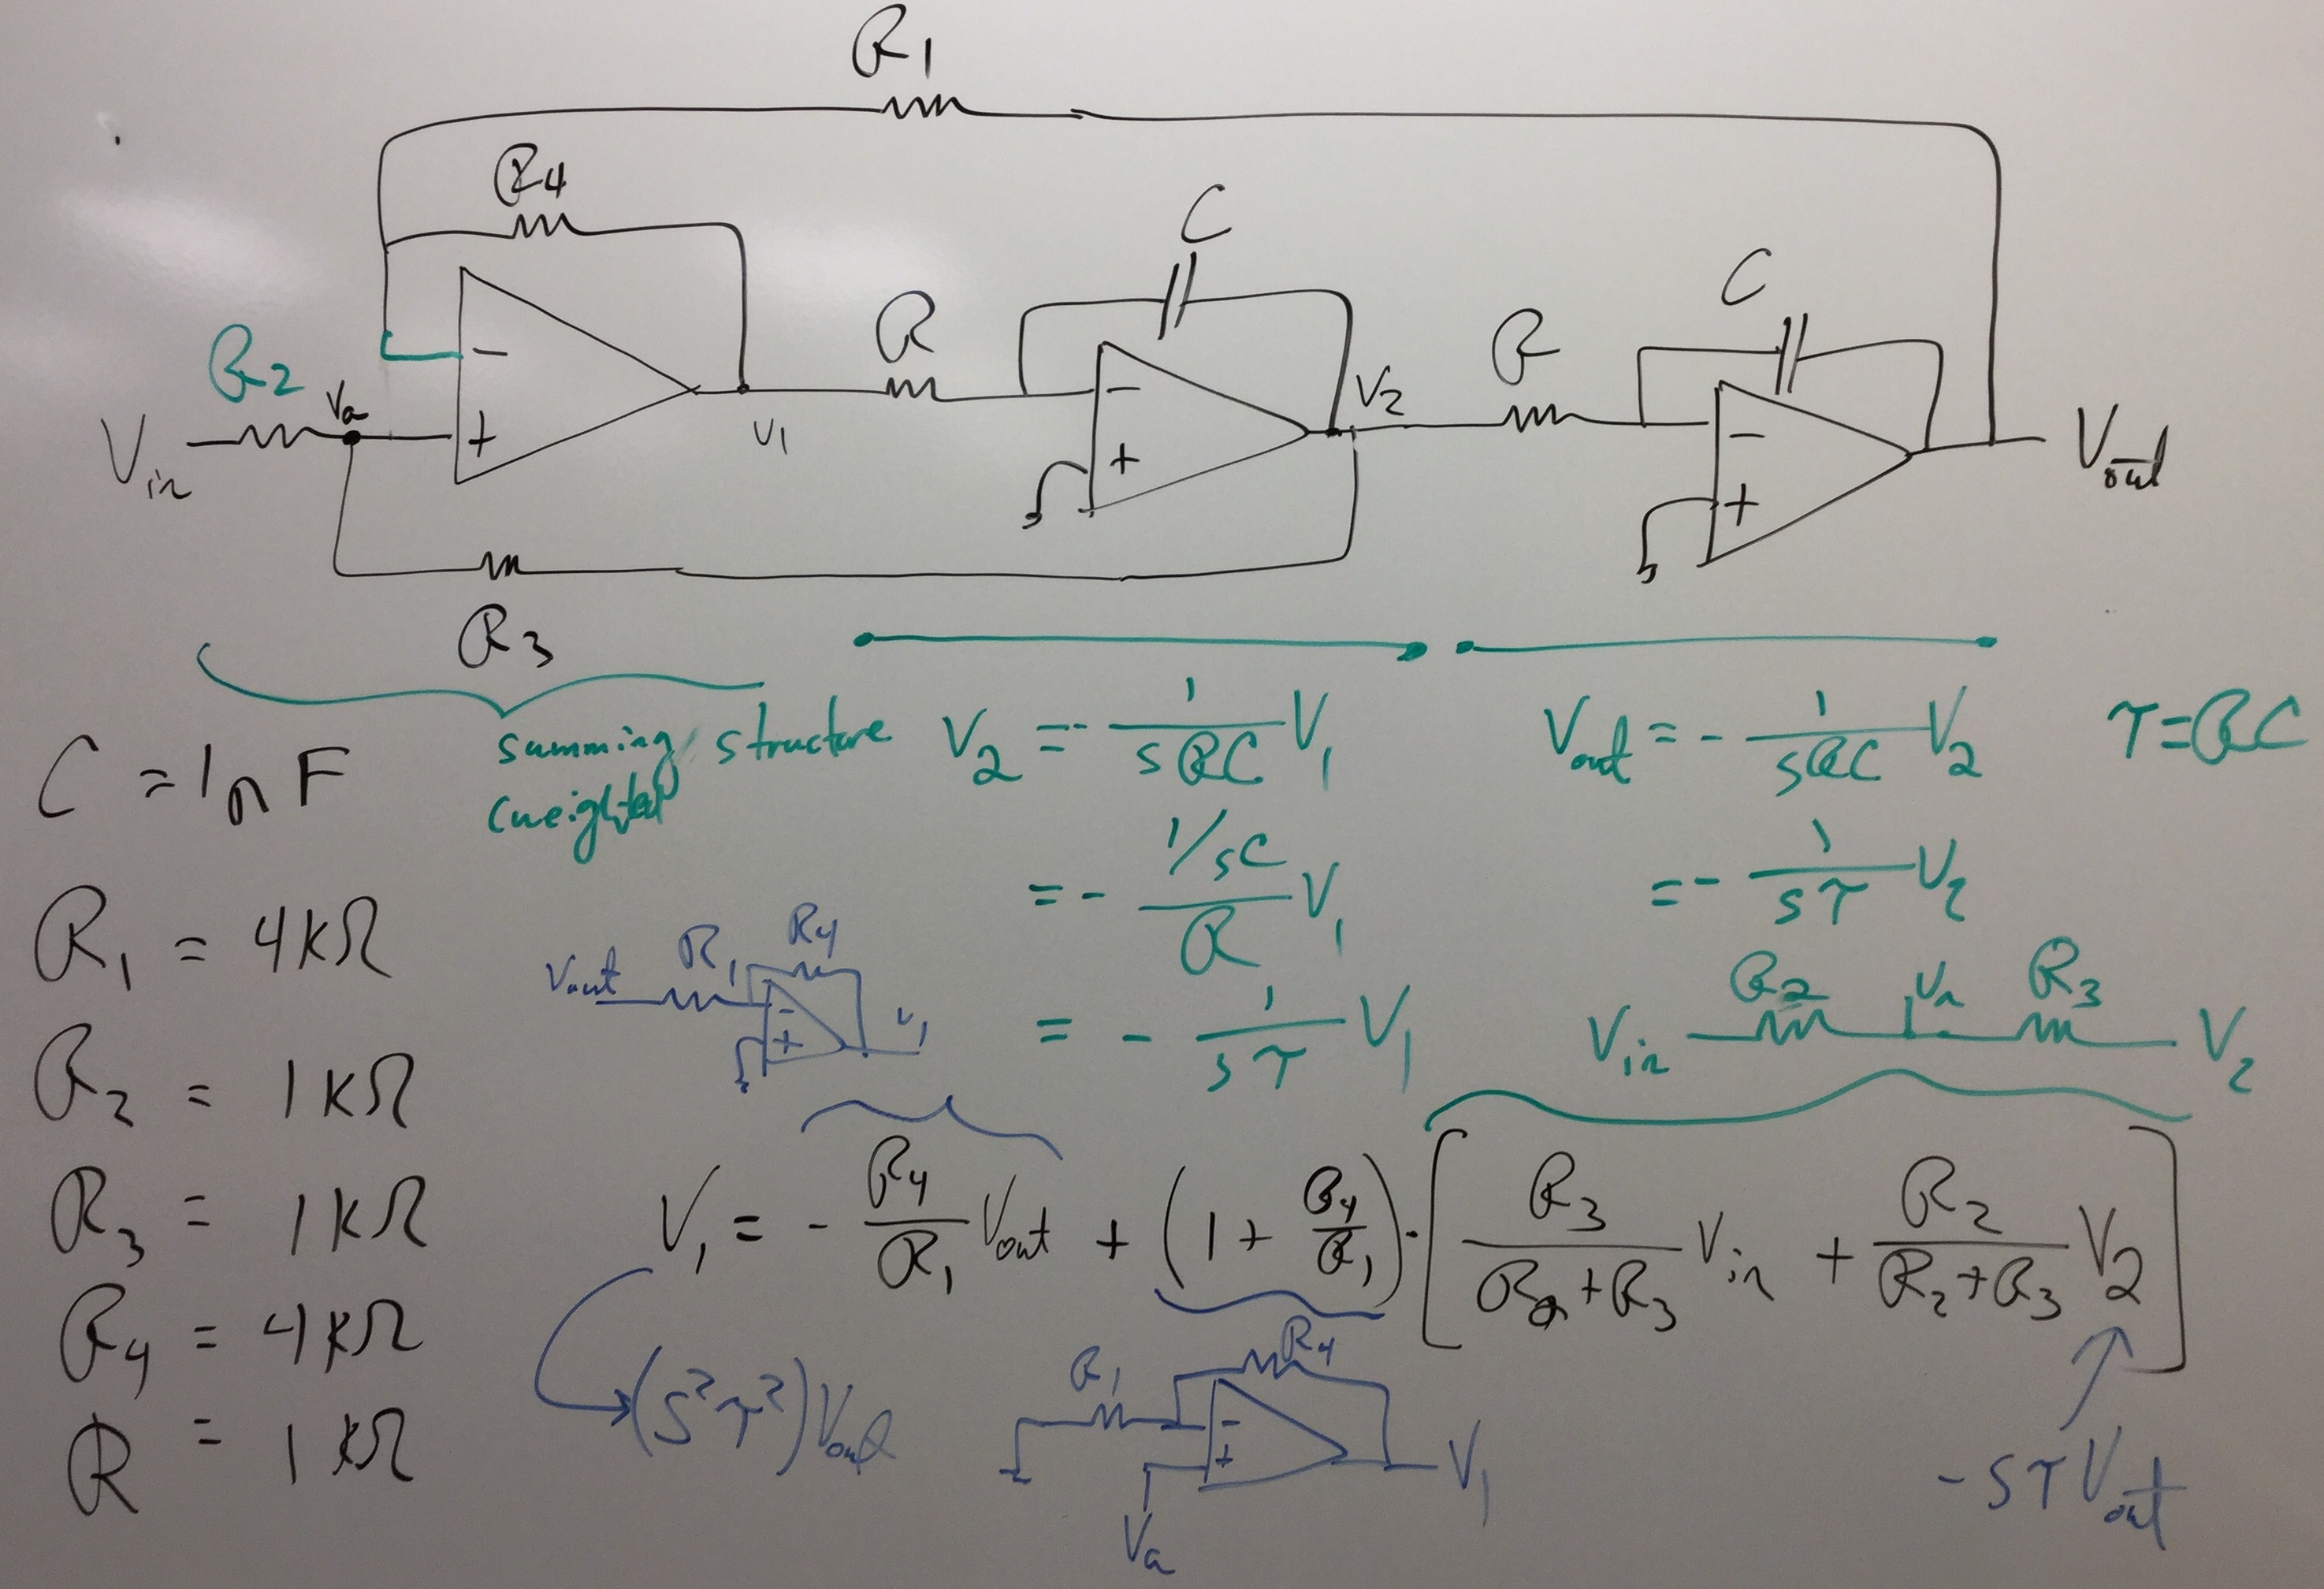
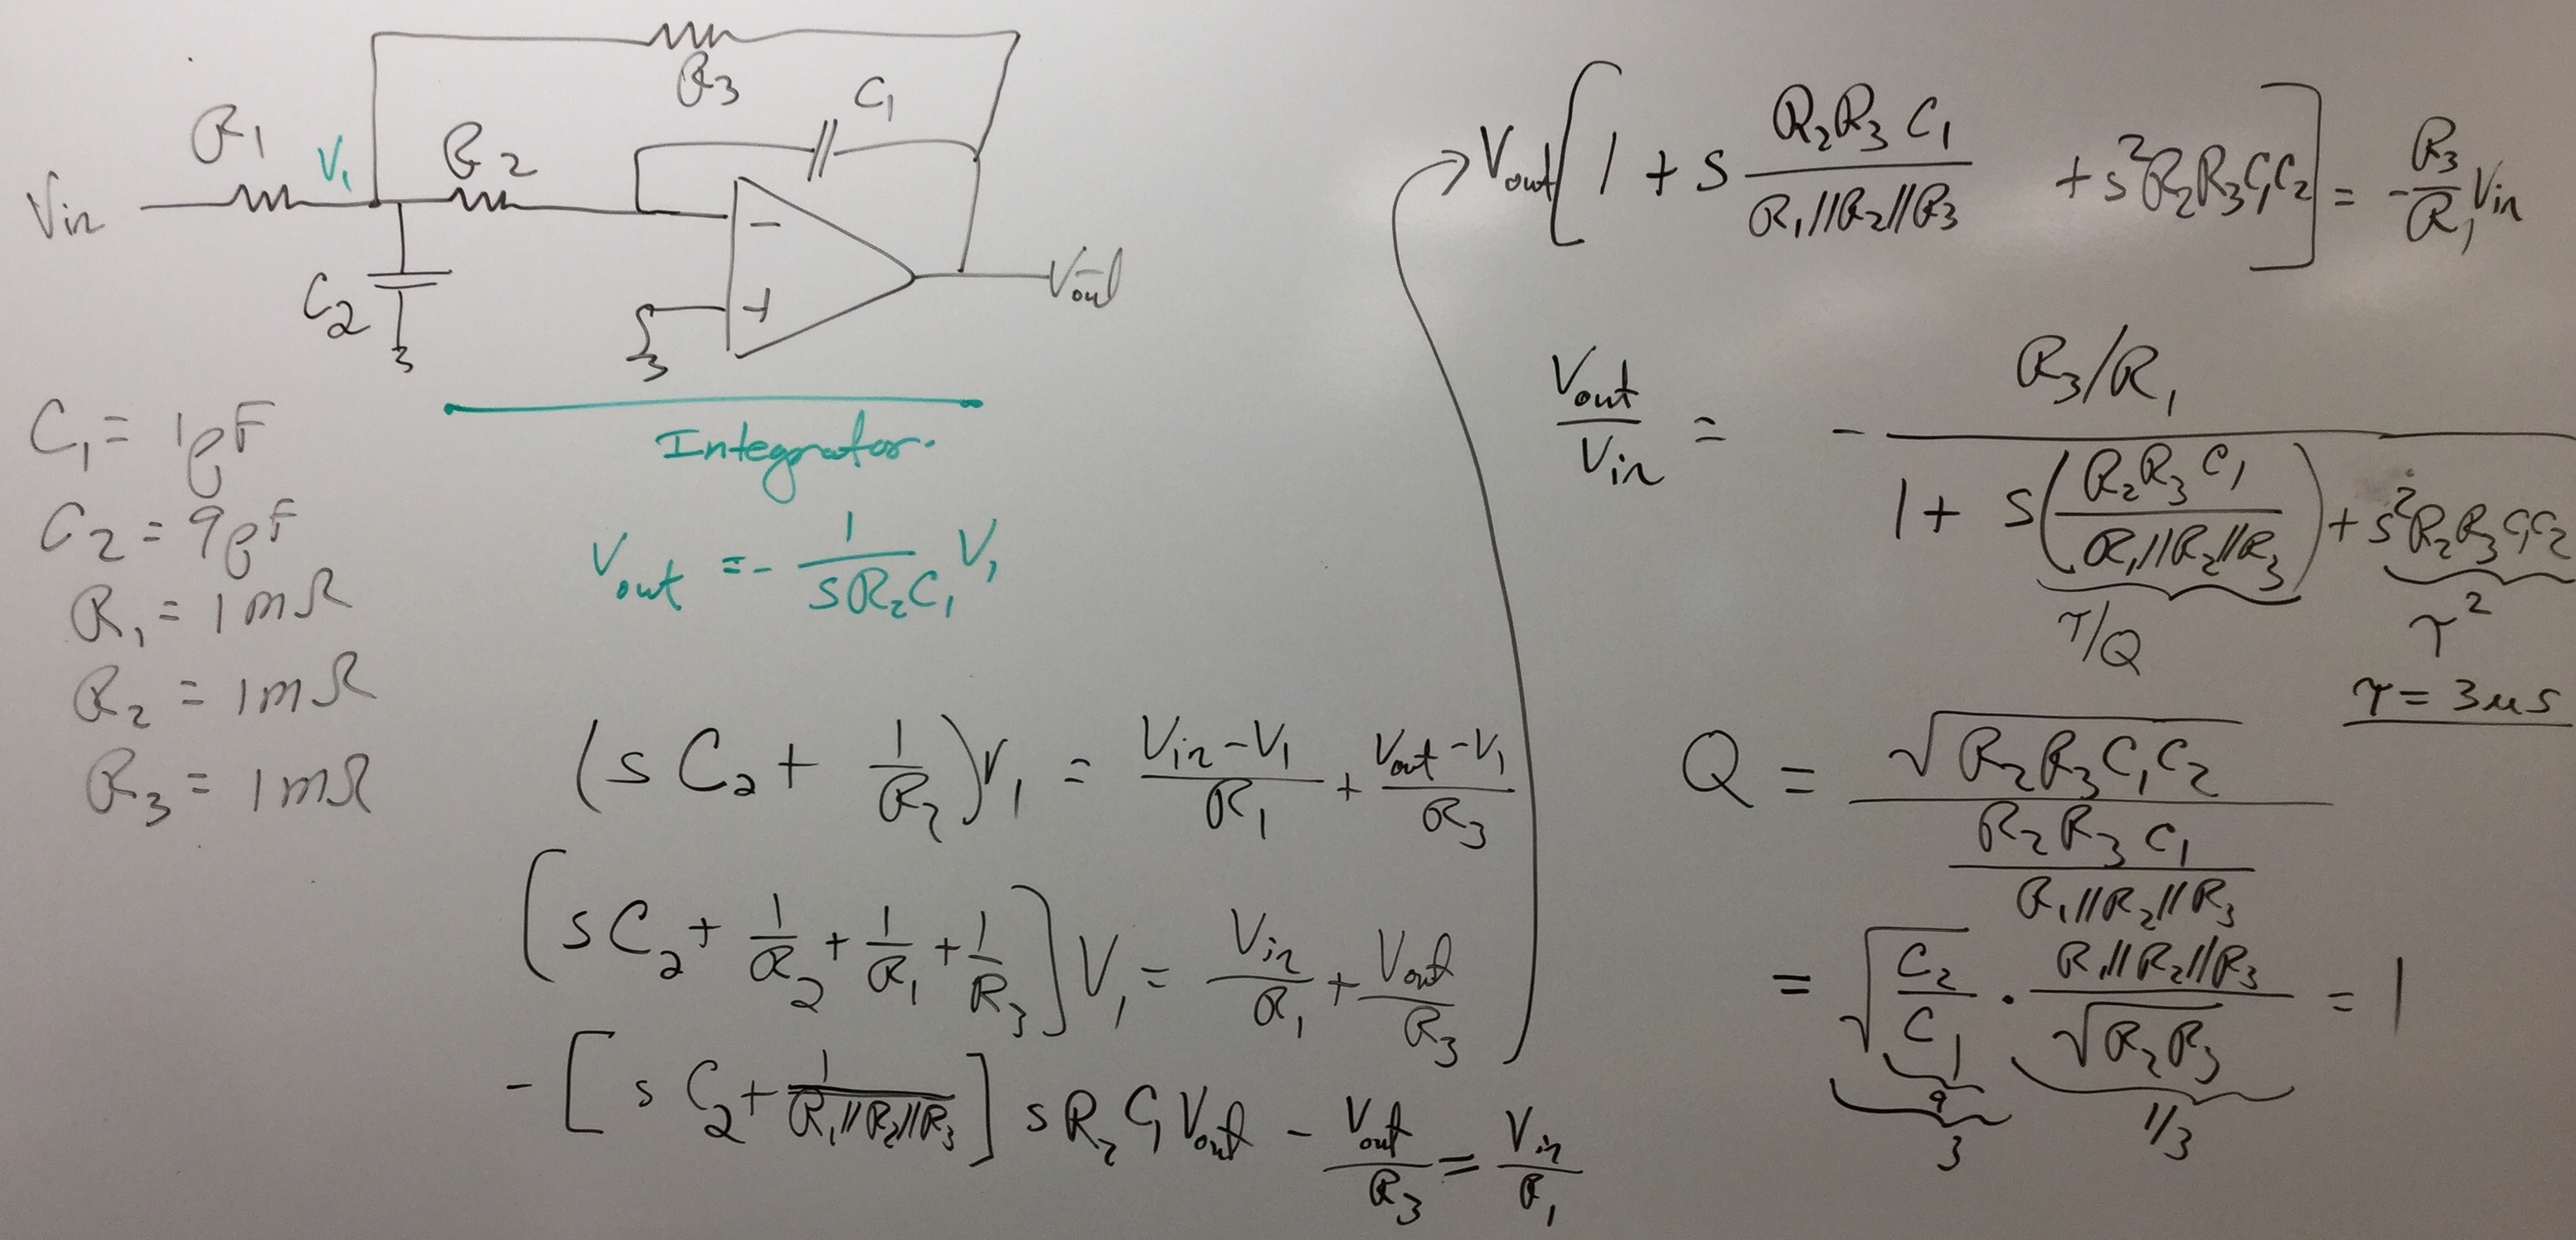
Second-Order Tau-Thomas,
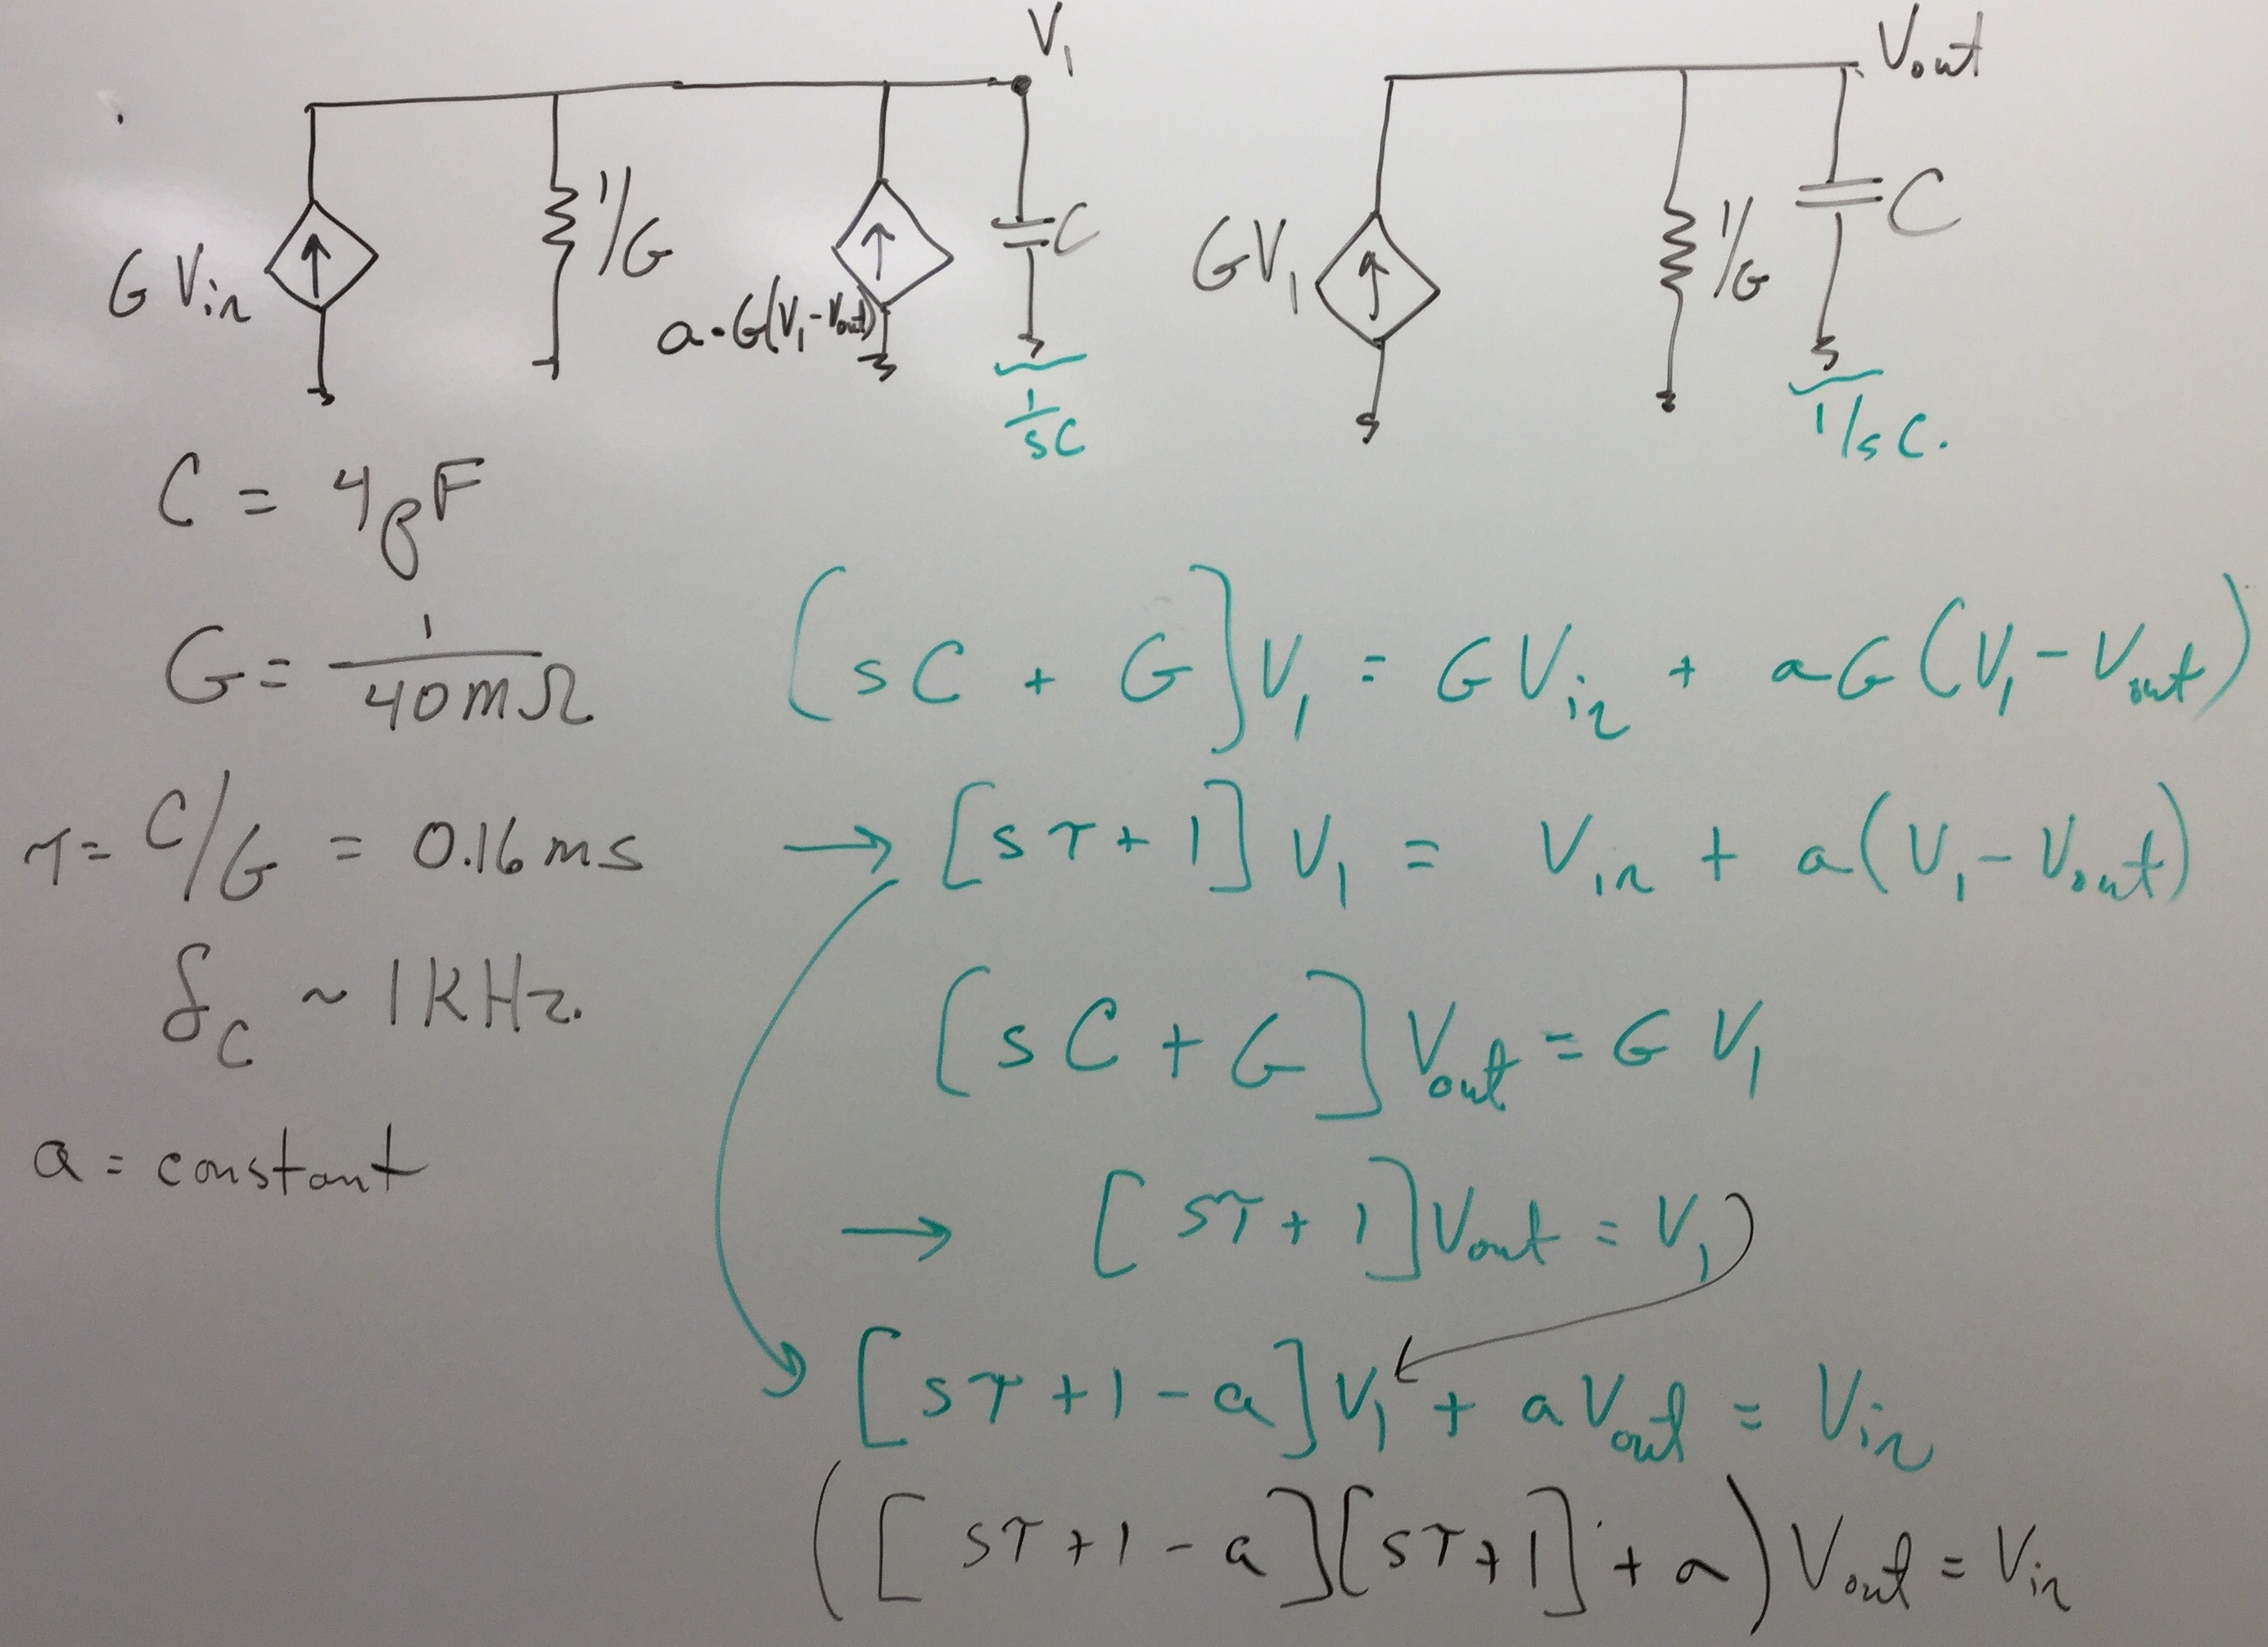
Dependent Current Source Tau-Thomas,
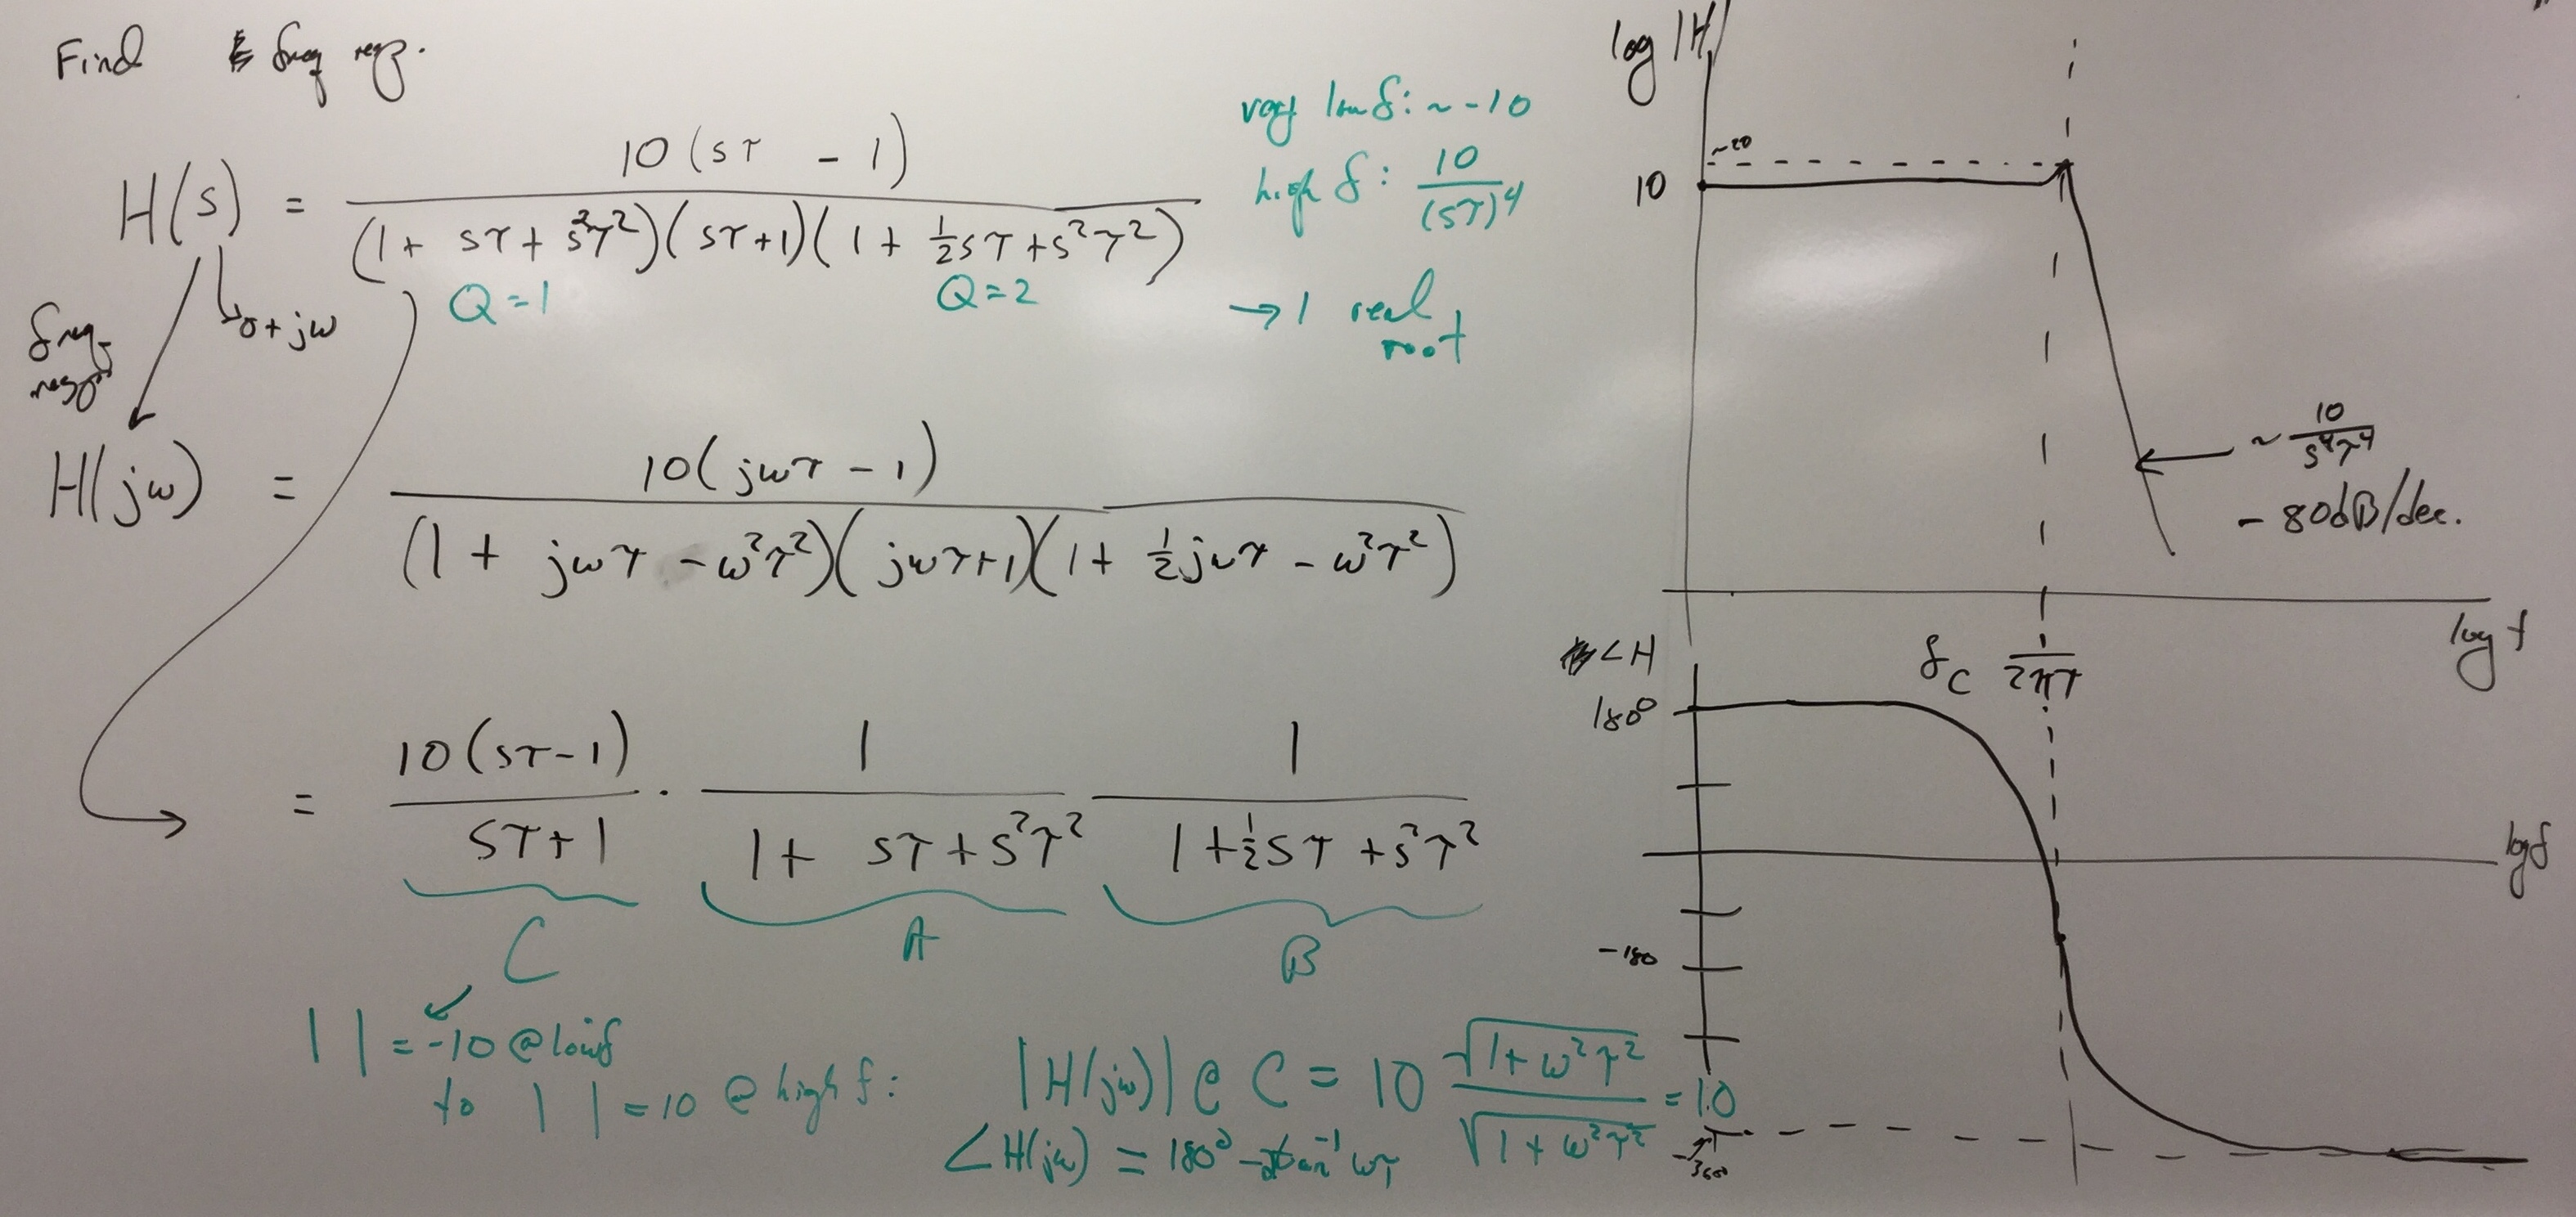
First-Order Amplifier,
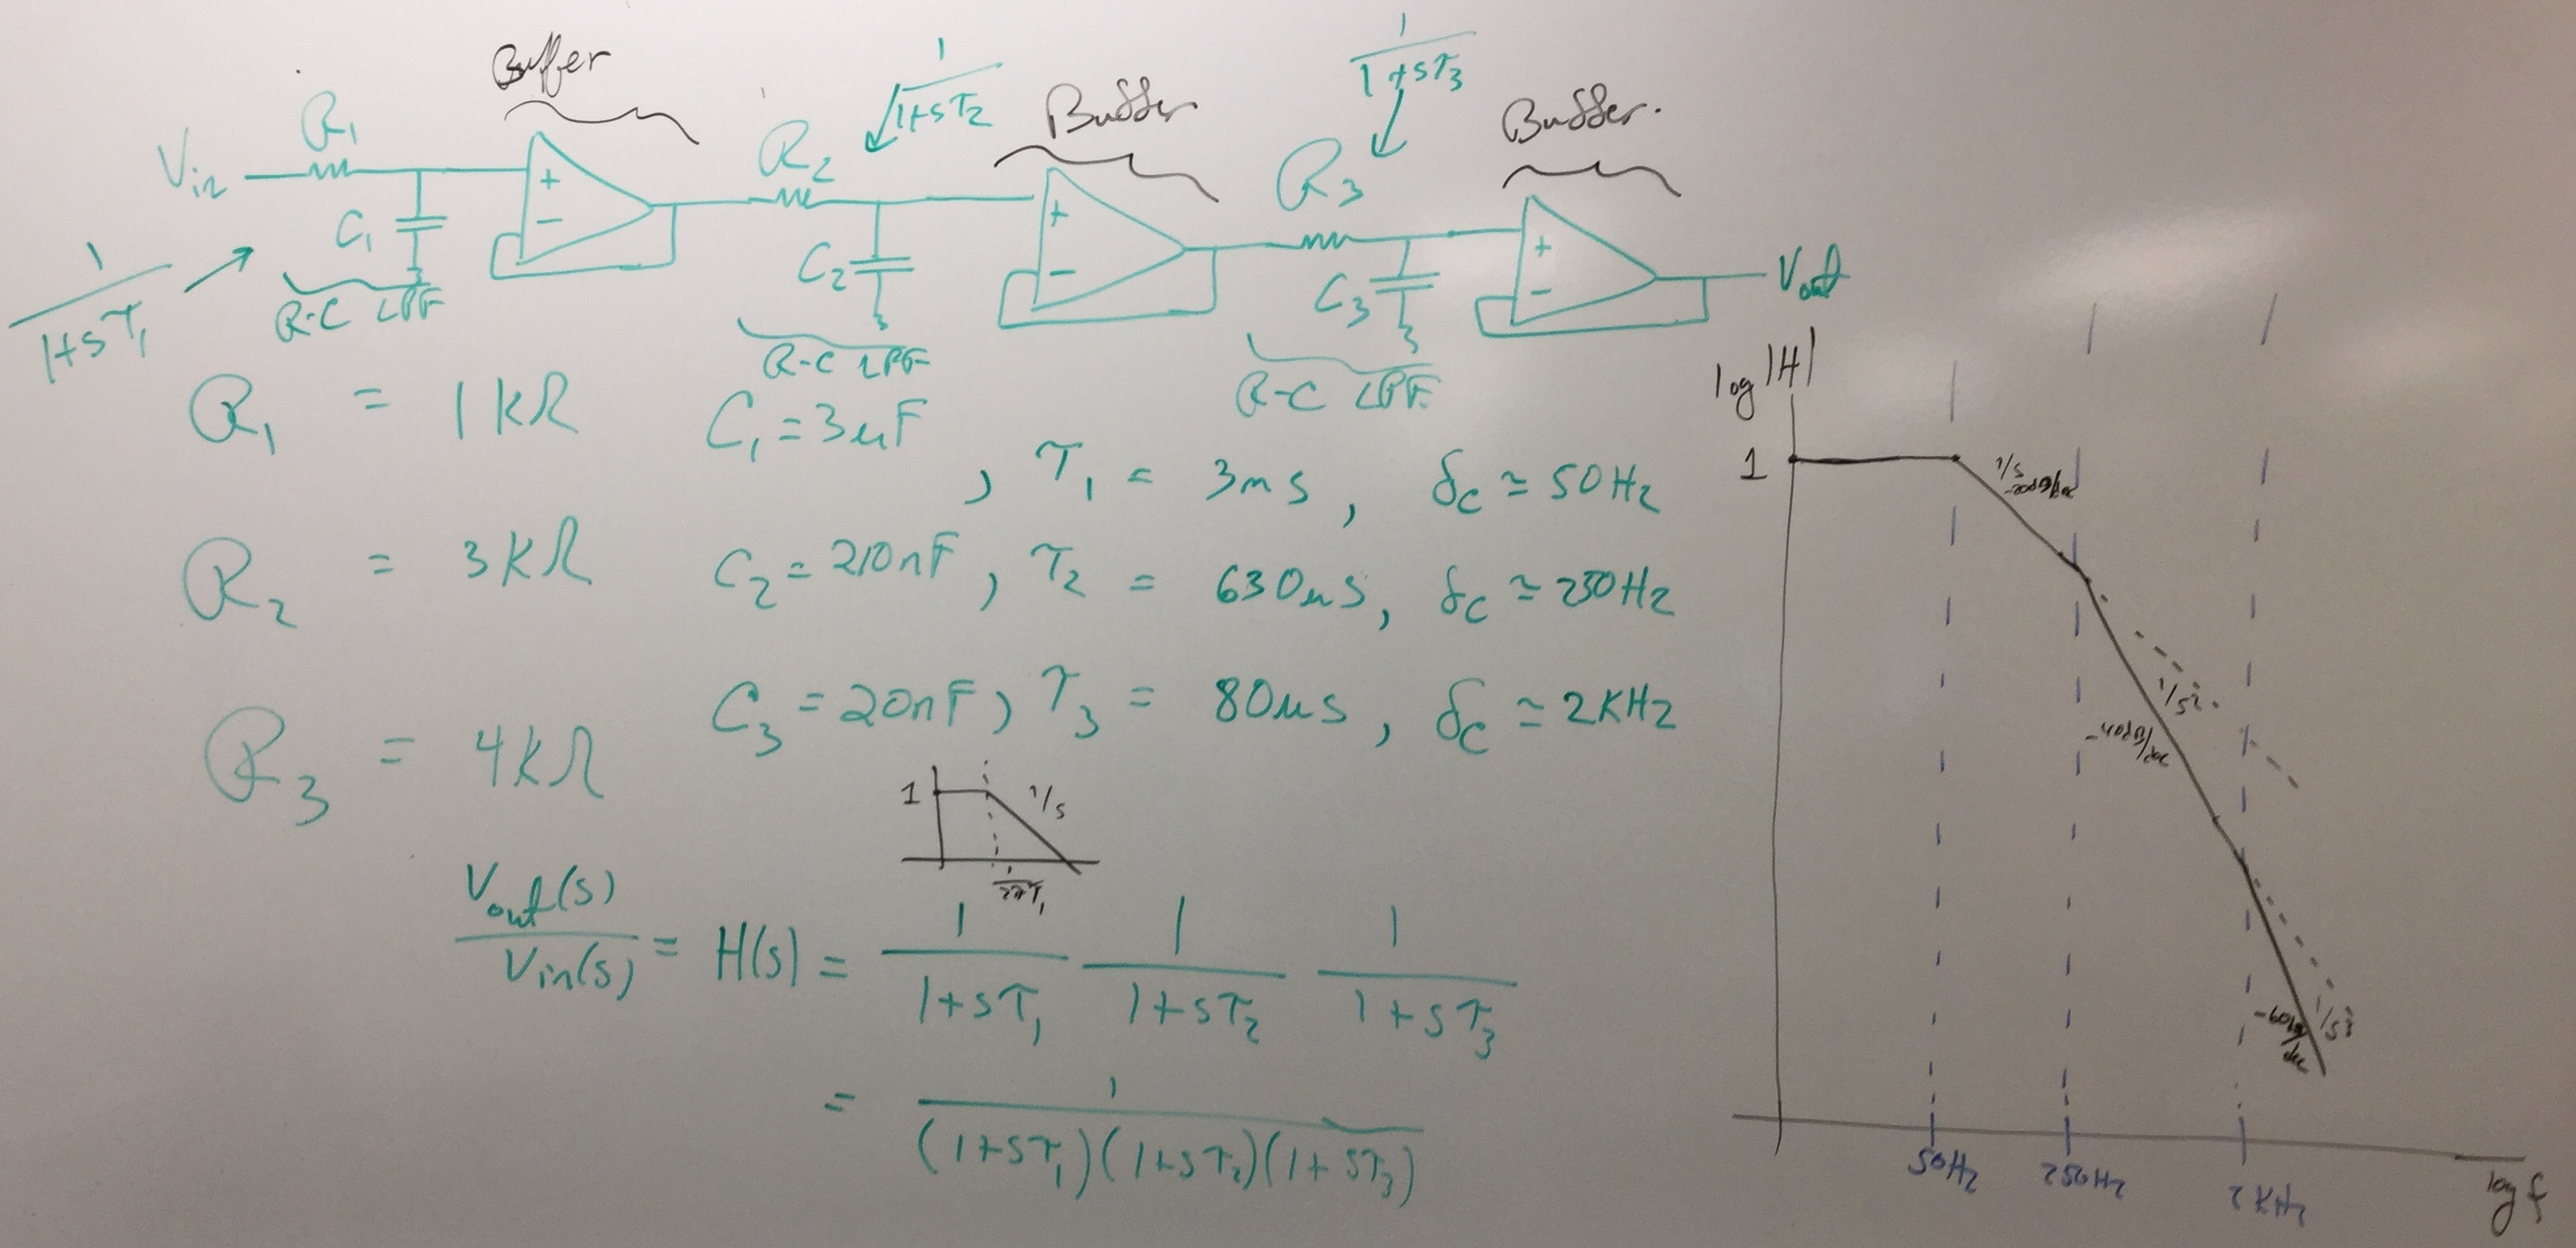
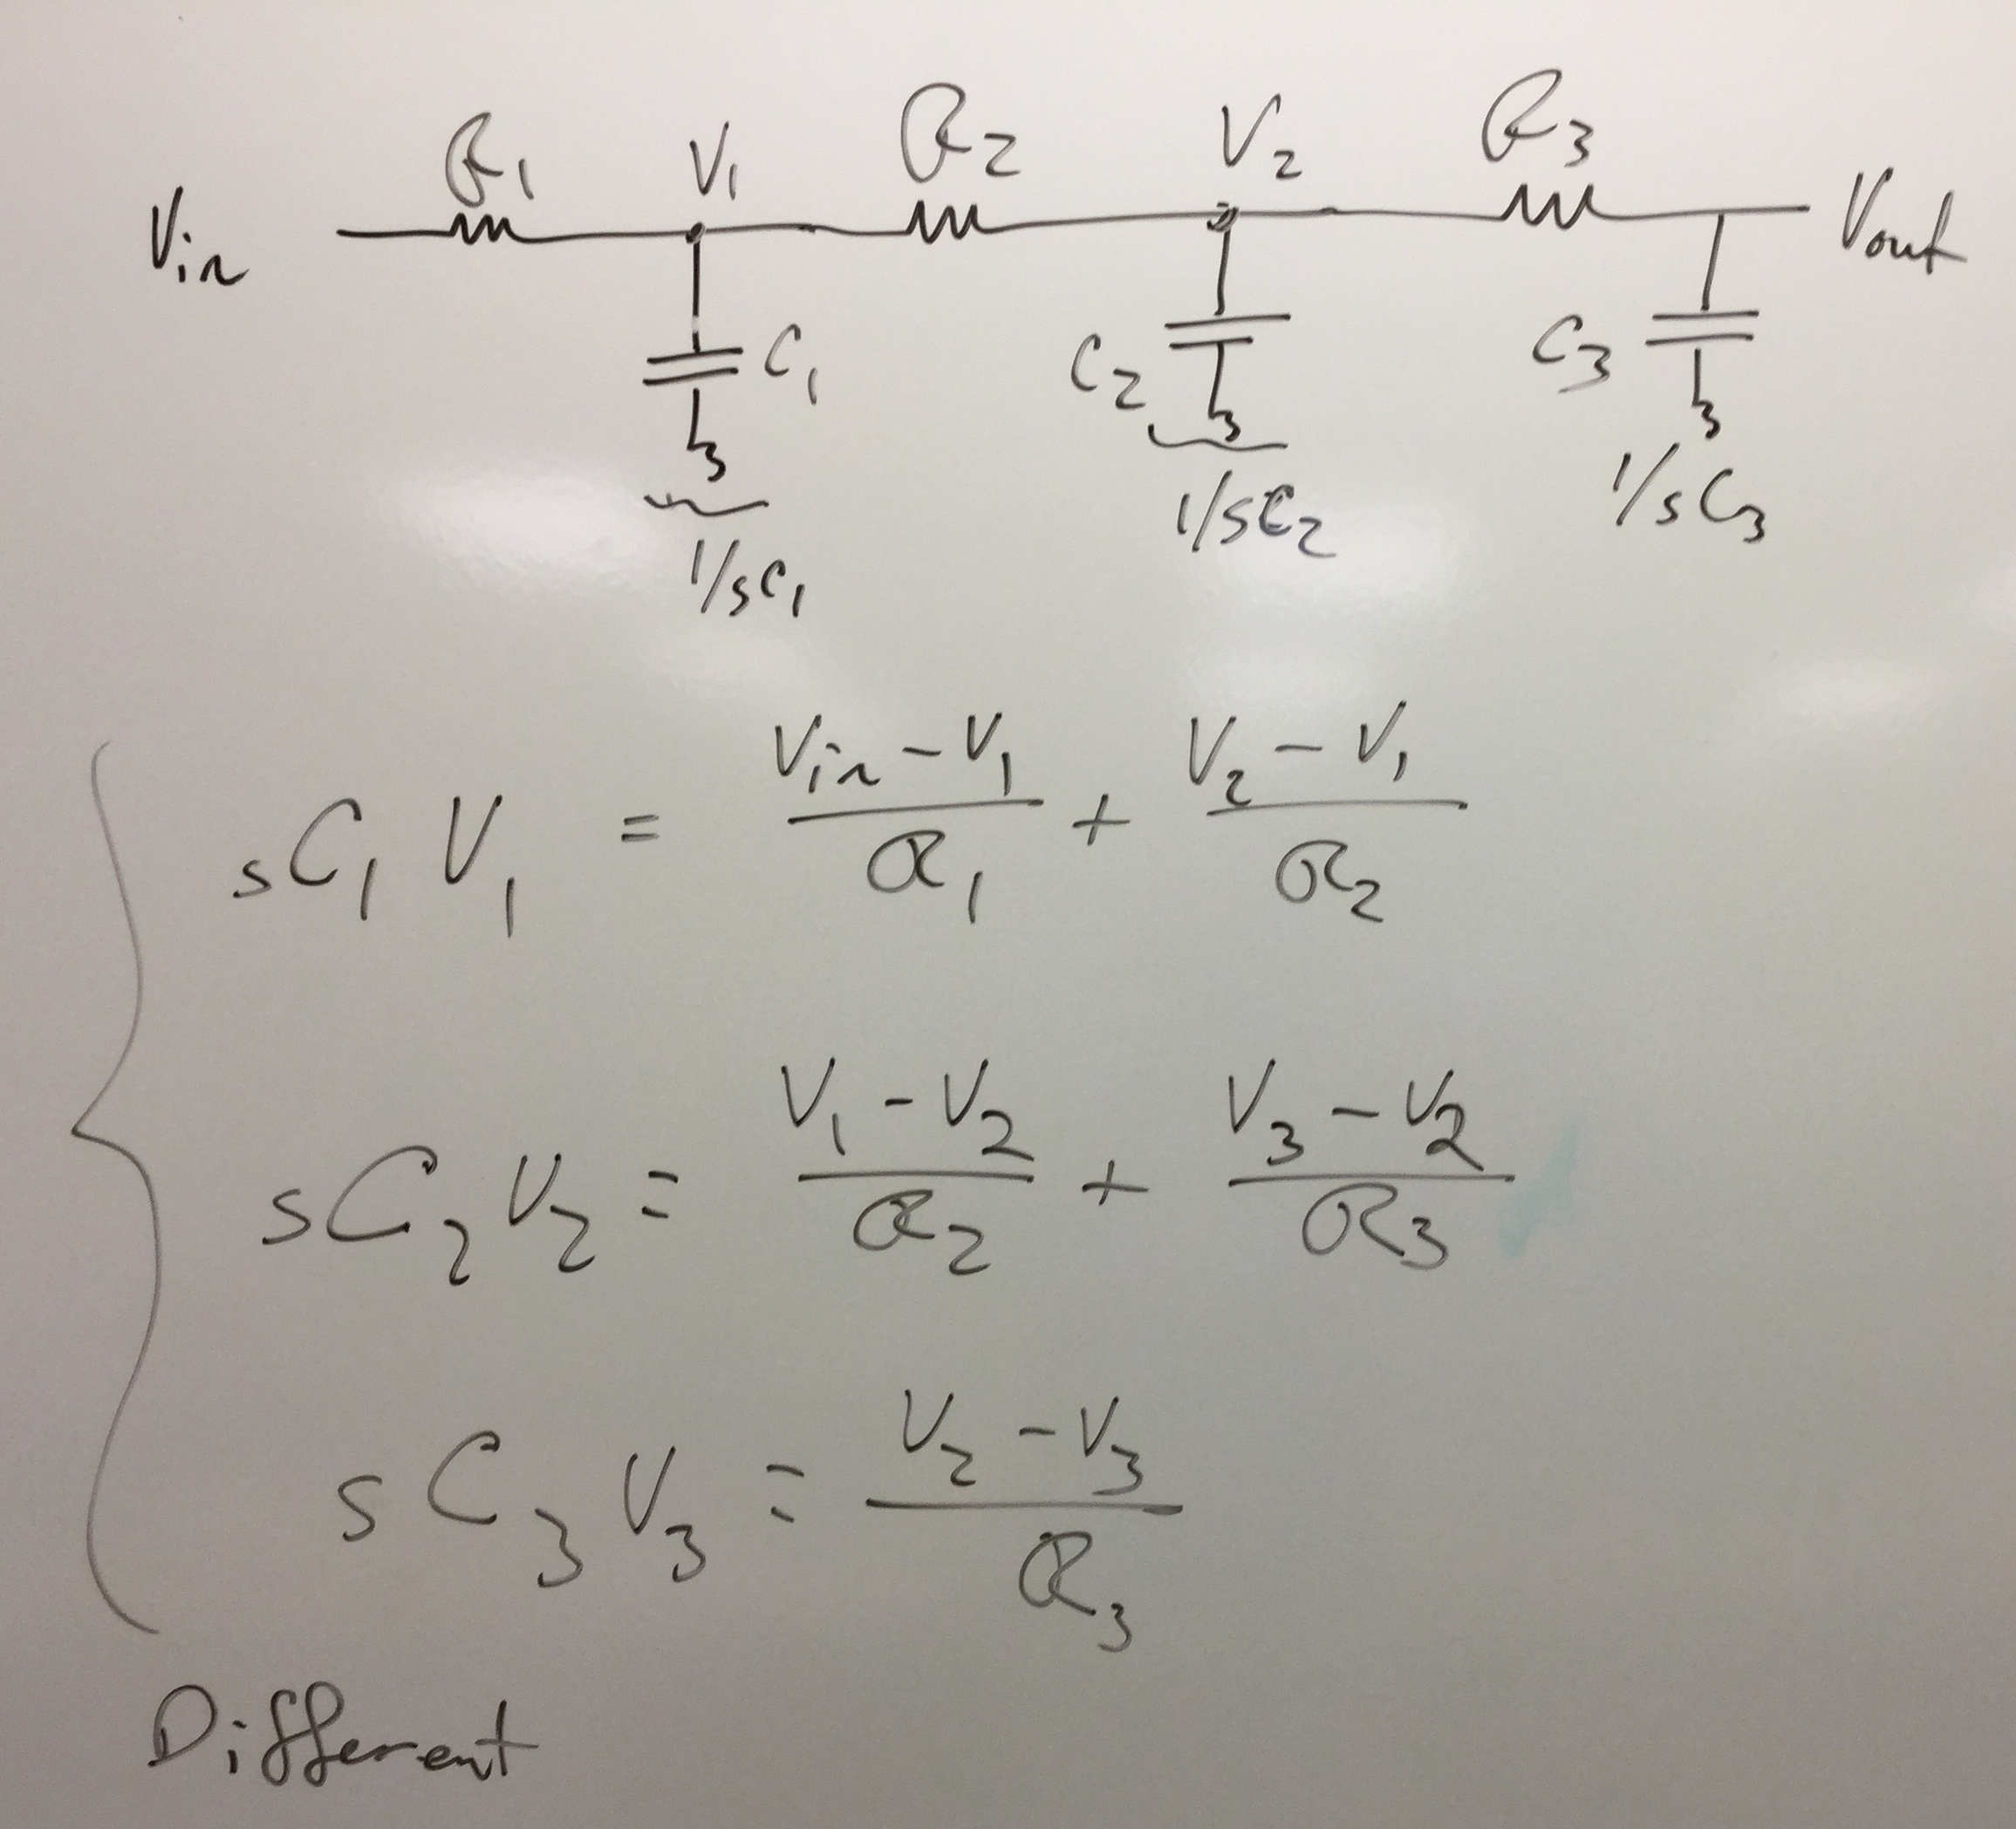
3rd order Butterworth Filter,
LC Network Circuit
|
1 ,
2 ,
3 ,
4 ,
5 ,
6 ,
|
|
Summary of items for the third exam:
pdf.
Exam from Spring 2019.
Exam from Fall 2020.
Slides from the taped lectures: pdf
Reading
For the third unit, there are a few parts of the textbook
that might be helpful to read for the discussions:
- Frequency Response, Fourier Transform and Fourier Series:
Chapter 13: 13.1, 13.2, 13.3.
Part of the reason we care about Fourier Series and Transform is because of the meaning of Frequency Response.
Fourier Series Overview (15.1, 15.2) that you should read through, but we won't be doing significant effort in computing fourier series. It is important to understand that the concept exists and periodic signals can be written as such a series, a series that relates to the Fourier and Laplace Transforms. Skimming 15.4 may be useful.
You will find the table of Fourier Series on
Pg. 759-760,
and the table of Fourier Transform Pairs on
pg. 782 - 783,
useful.
One should read through the
Fourier Spectrum (15.6) that is both an experimental technique as well as one bridge to the Fourier Transform (15.9).
One should read 15.9, 15.10 as well, as a simplification of the Laplace Transform (15.13 which should be read).
-
Behavior of Second-Order Linear Circuits (Section 9.1-9.8).
The section talks about second-order circuits,
and some aspects are clearer now that we have already addressed Laplace Transforms.
Understanding second-order linear ODEs is essential for most physical system discussions.
Frequency response of Resonant Circuits (13.4)
Frequency Reponse of Op-Amp Circuits (13.5)
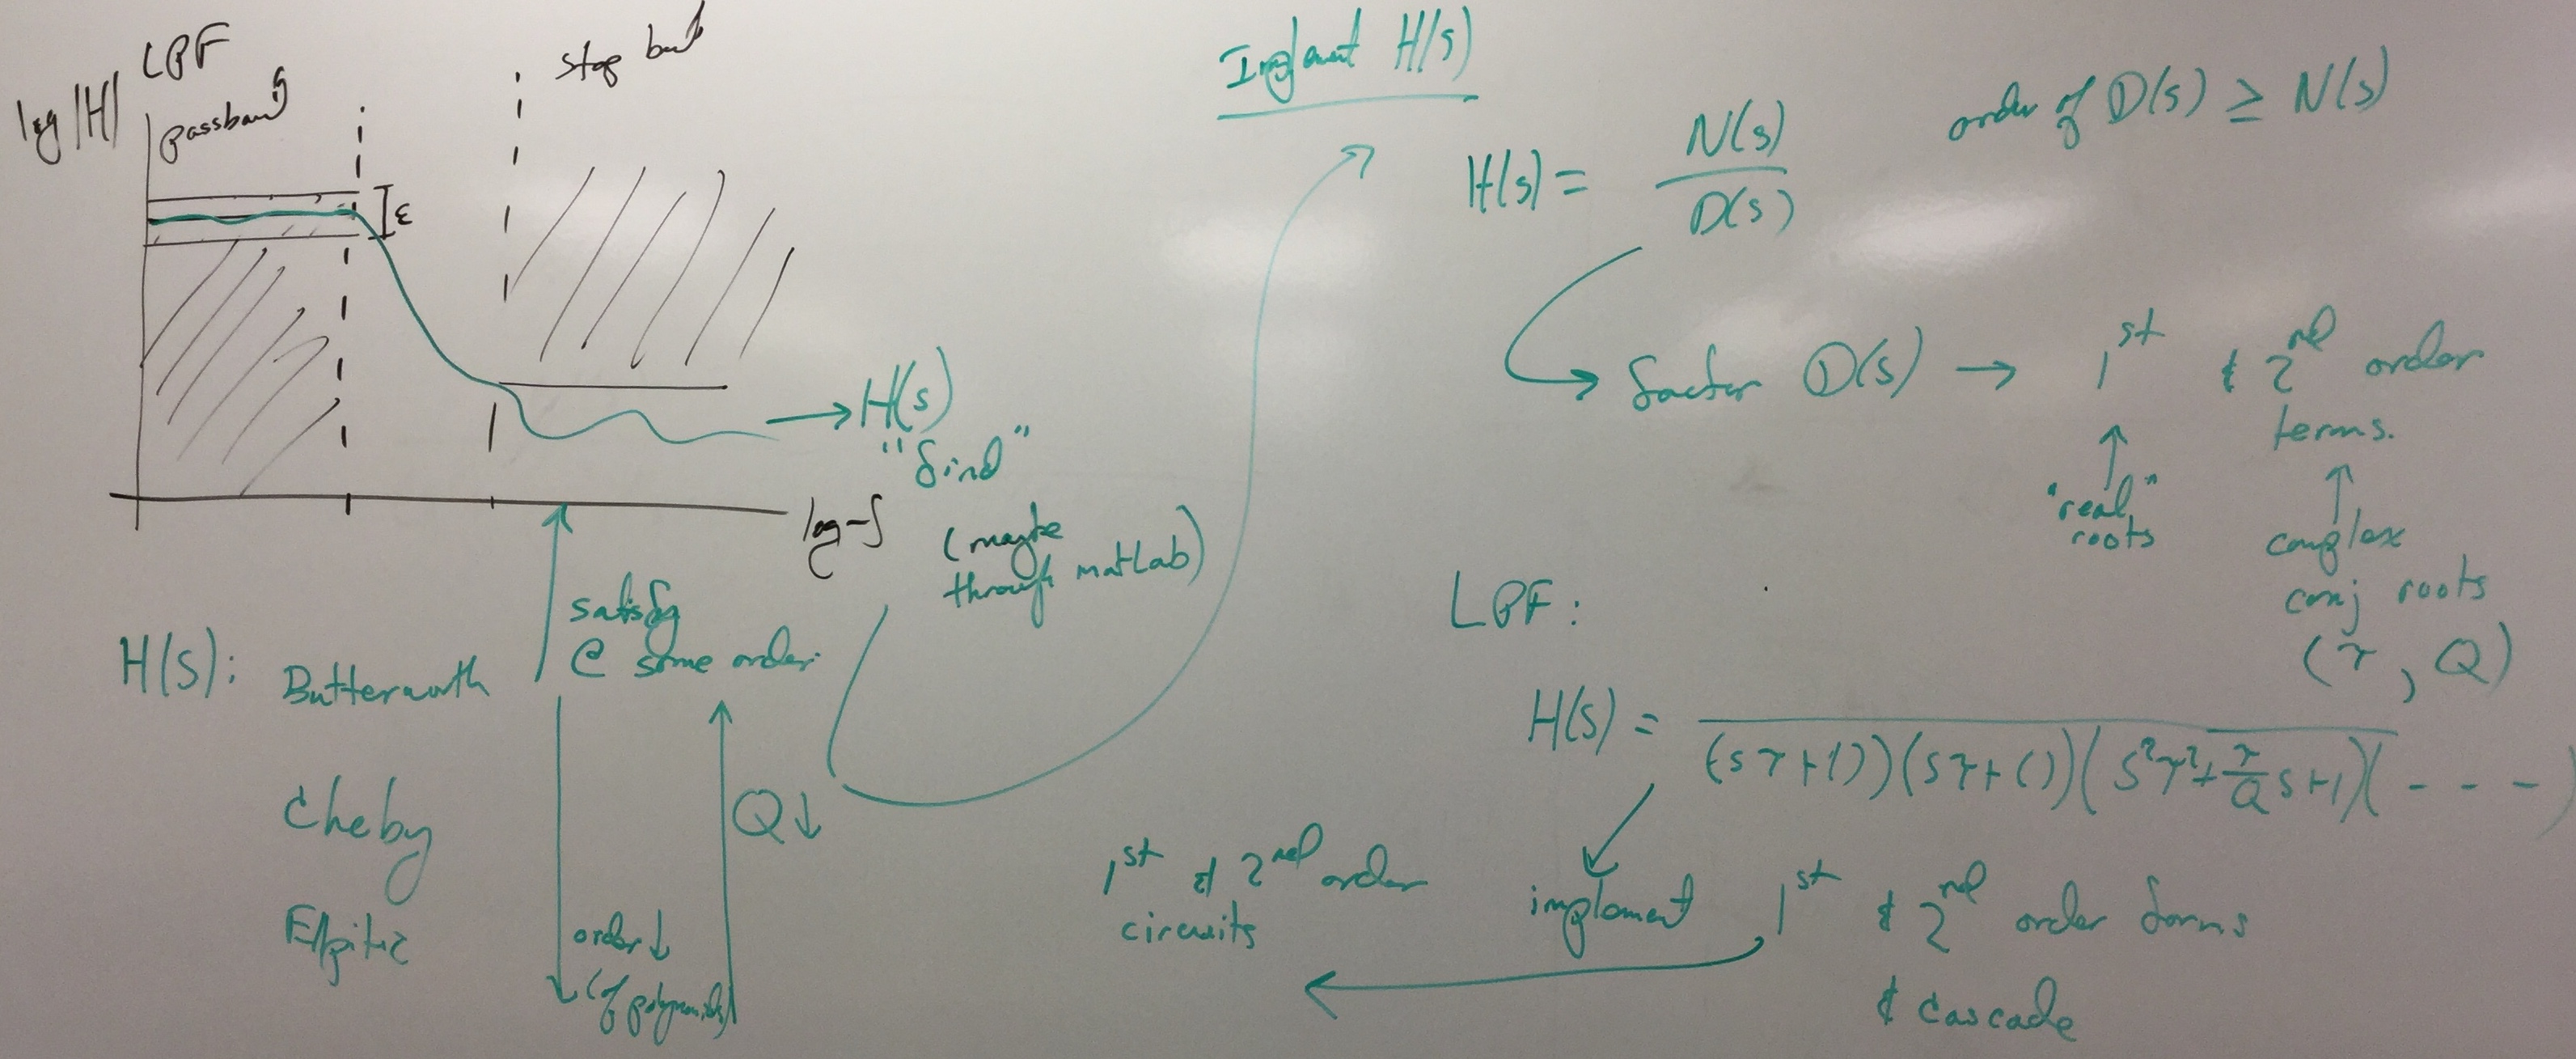
- We will look at applications of linear circuits, including filtering circuits.
Filters with Linear Circuits includes
initial reading in 16.2, 16.3,
Second-Order Filters (16.4),
and Higher-Order Filters (16.5)
-
You might find Chapter 10 is a good review of some concepts using a concept of a sinusoid represented by a
a phasor for a single frequency (a single complex number).
Sometimes these techniques are useful for circuit analysis when only a single frequency is used,
as in RF communication circuits and trasmission power (Chp. 11), or electrical power circuits (Chp. 12).
Some outside sources that are worth considering:
- Review notes on different Seccond-Order Behavior from
Swathmore
Assigned Homework Problems
Problems to be Submitted
- Set 6, Due Oct 20:
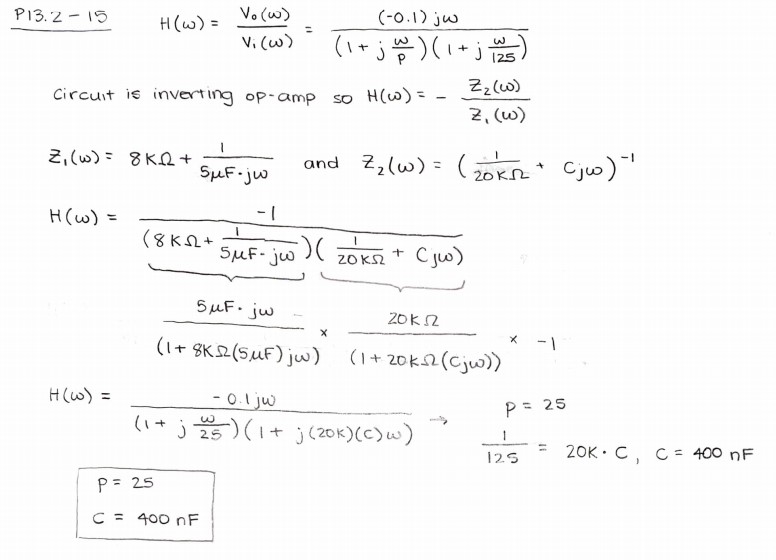
13.2-15
Solution,
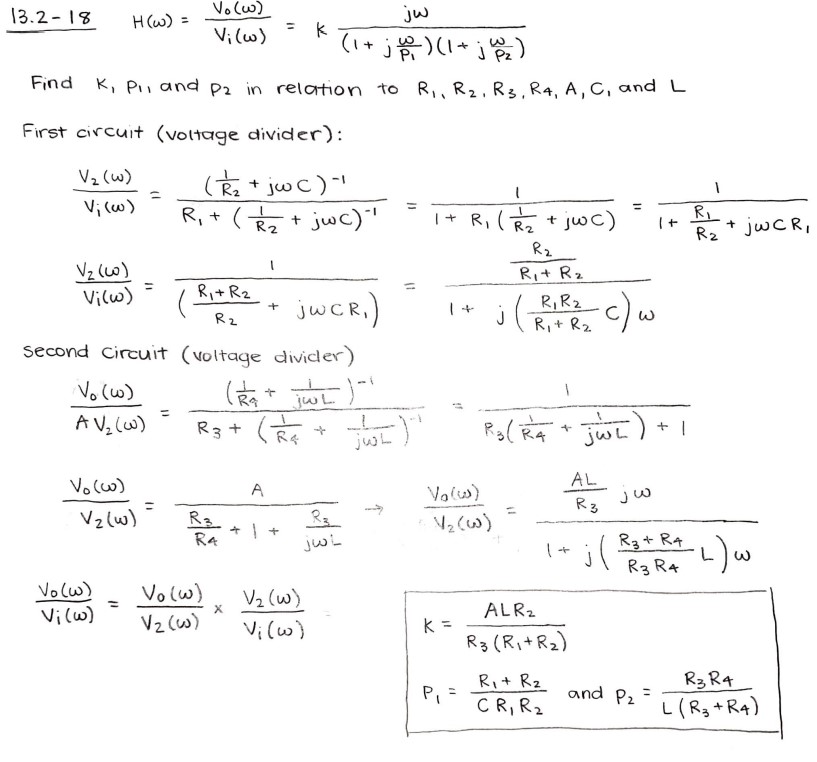
13.2-18
Solution,
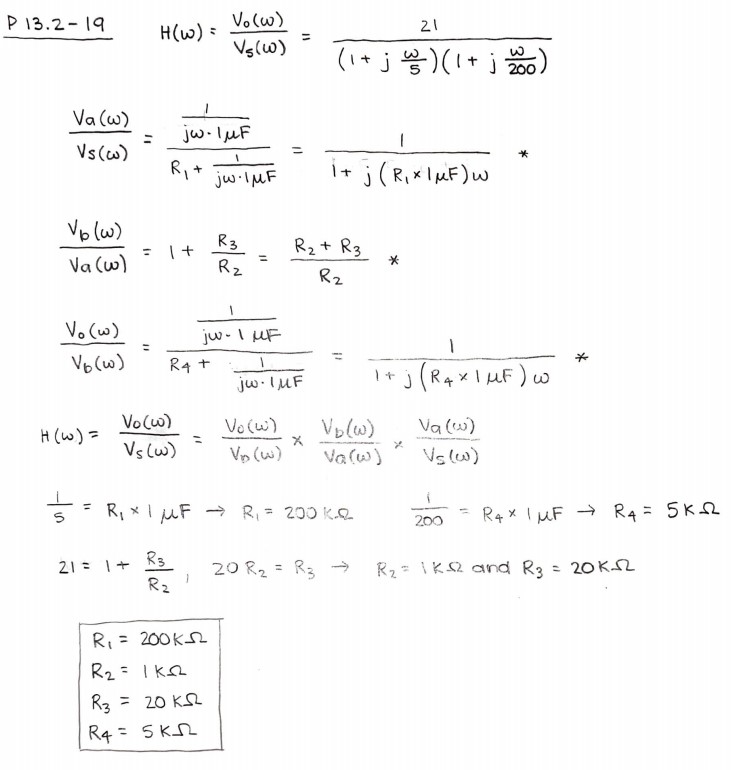
13.2-19
Solution,
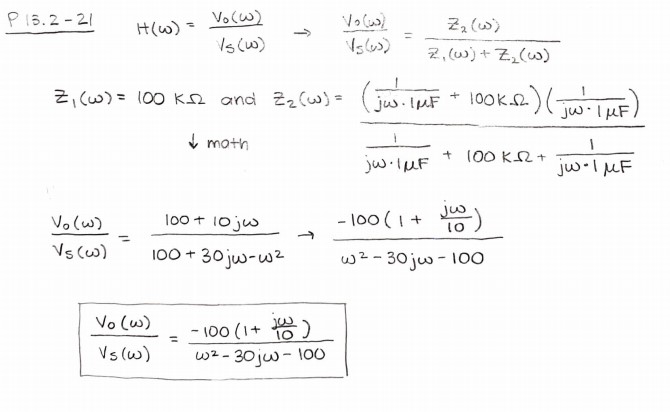
13.2-21
Solution,
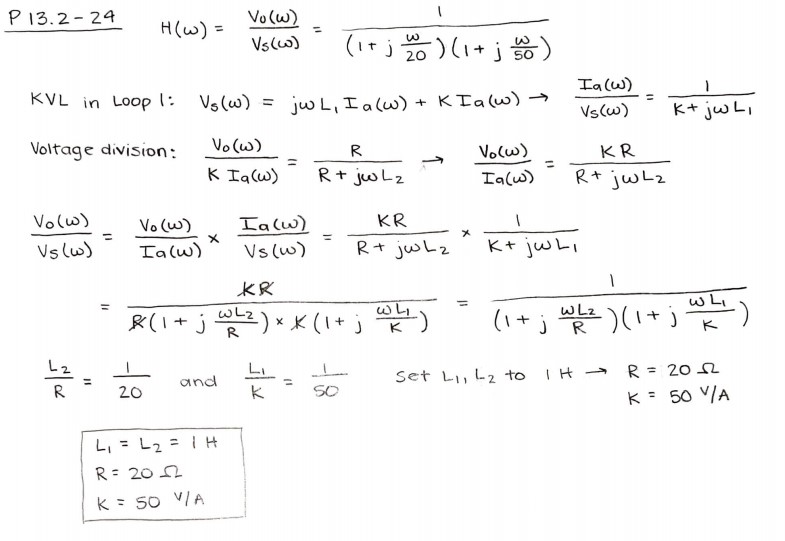
13.2-24
Solution,
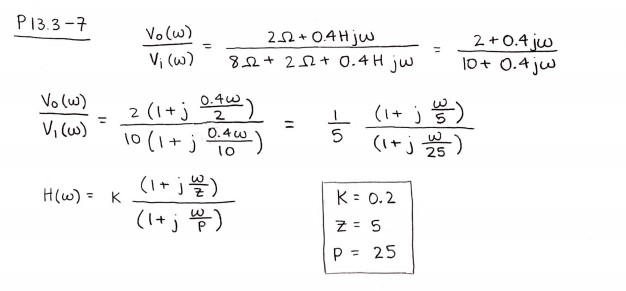
13.3-7
Solution,
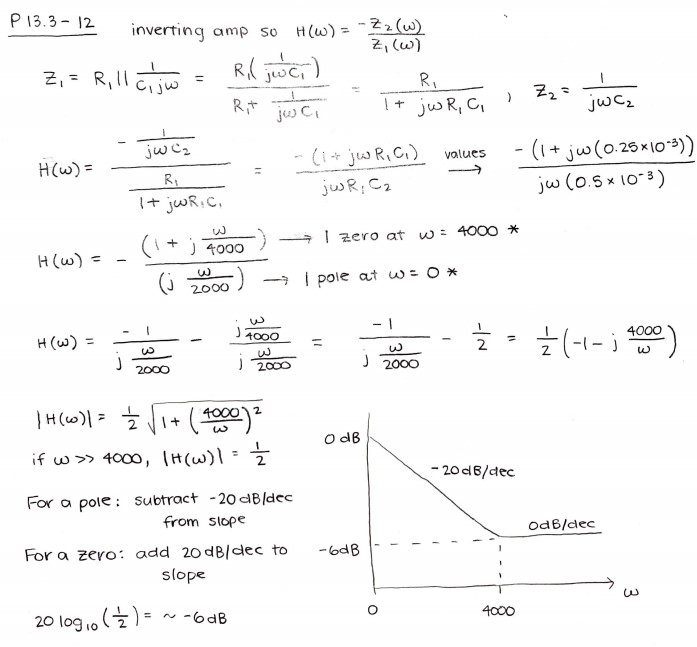
13.3-12
Solution,
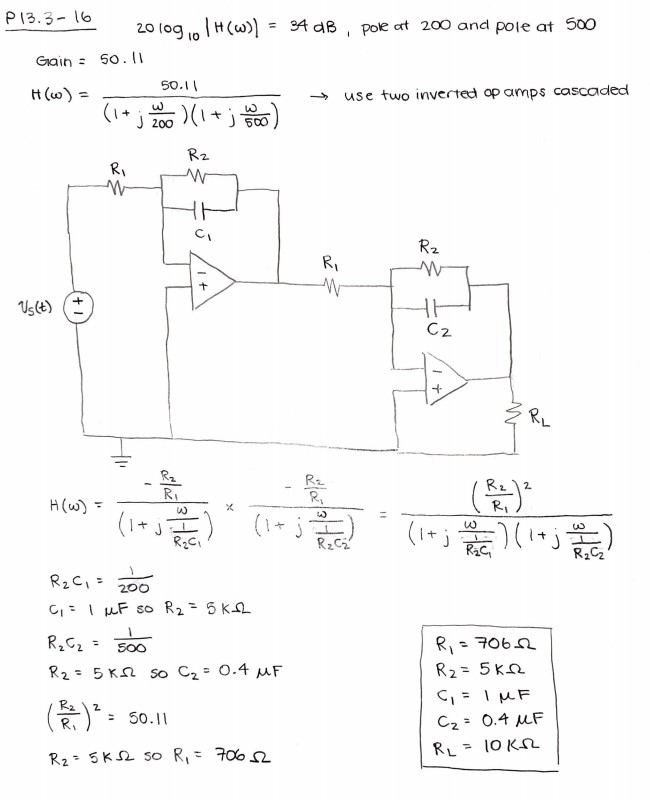
13.3-16
Solution,
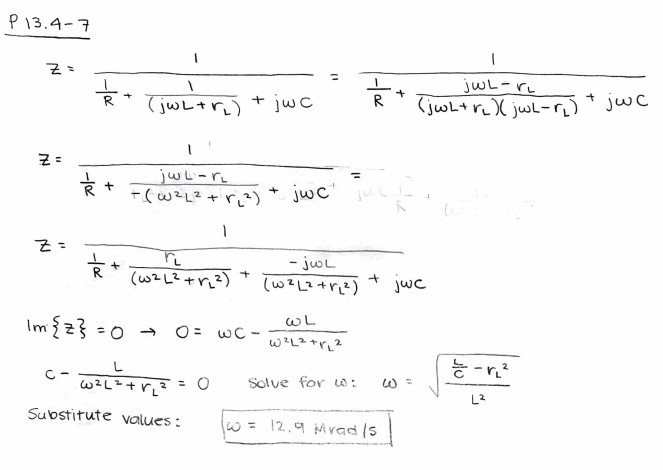
13.4-7
Solution,
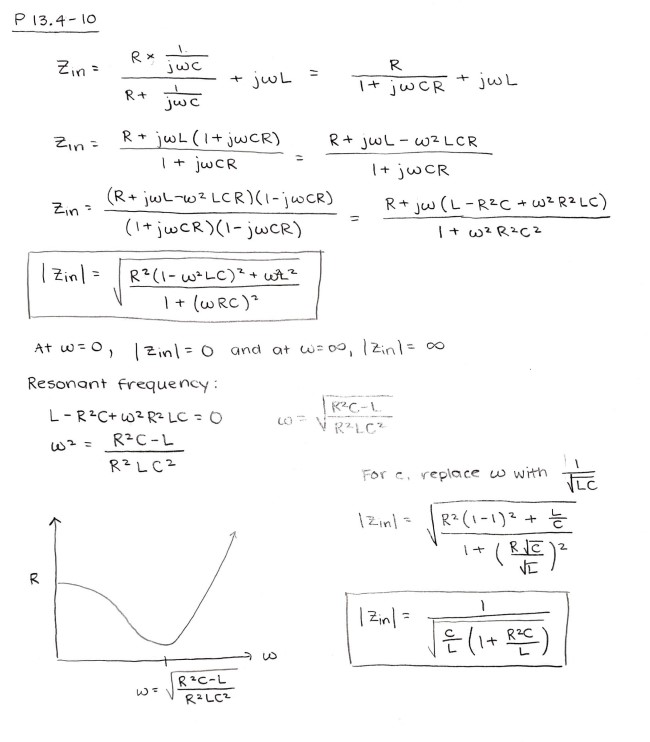
13.4-10
Solution,
- Set 7, Due Oct 27:
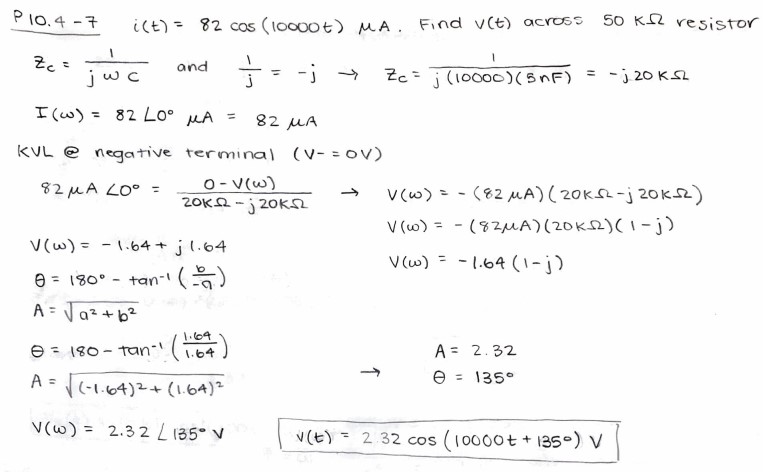
10.4-7
Solution,
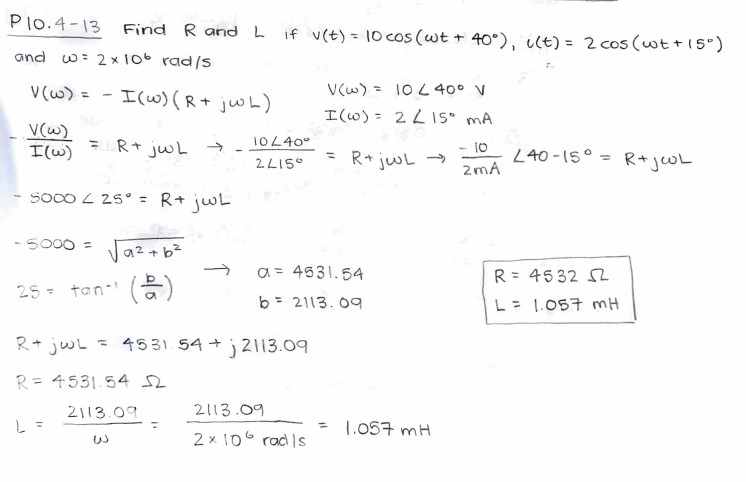
10.4-13
Solution,
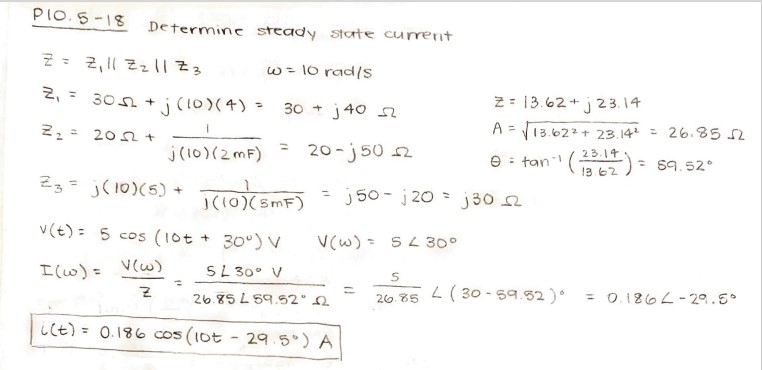
10.5-18
Solution,
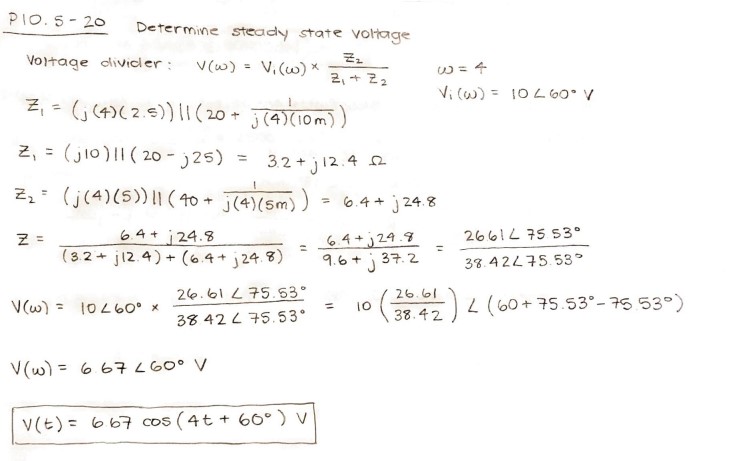
10.5-20
Solution,
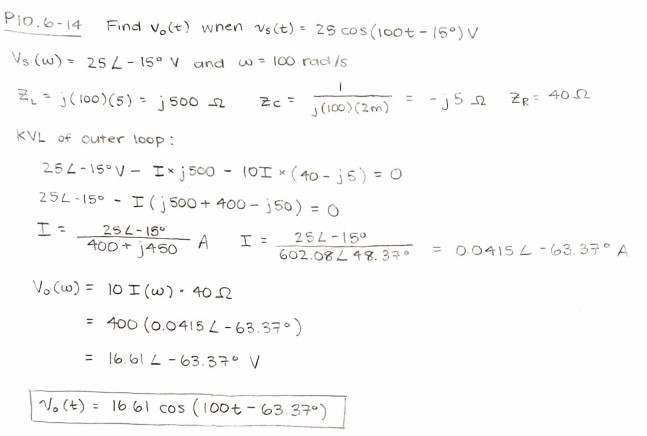
10.6-14
Solution,
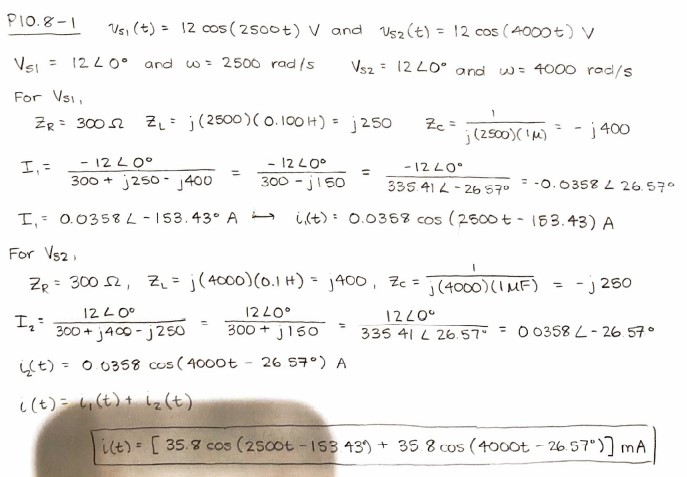
10.8-1
Solution,
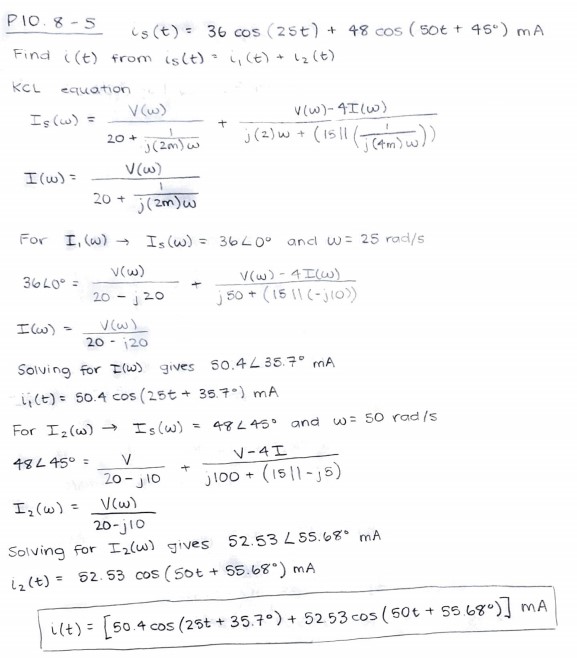
10.8-5
Solution,
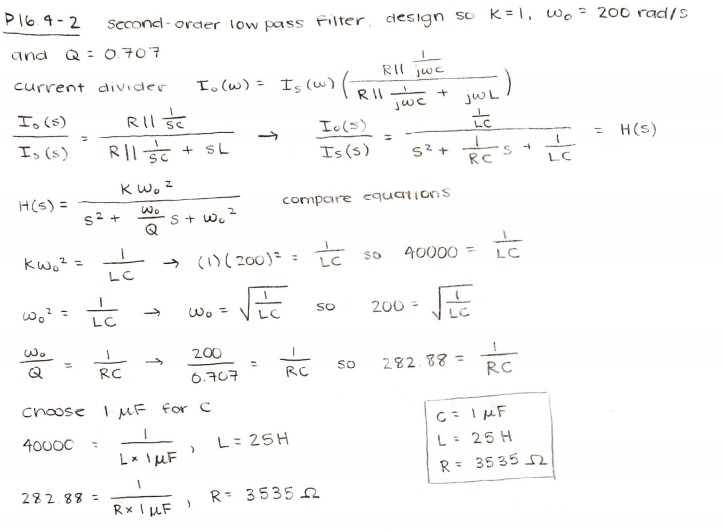
16.4-2
Solution,
16.4-4
Solution,
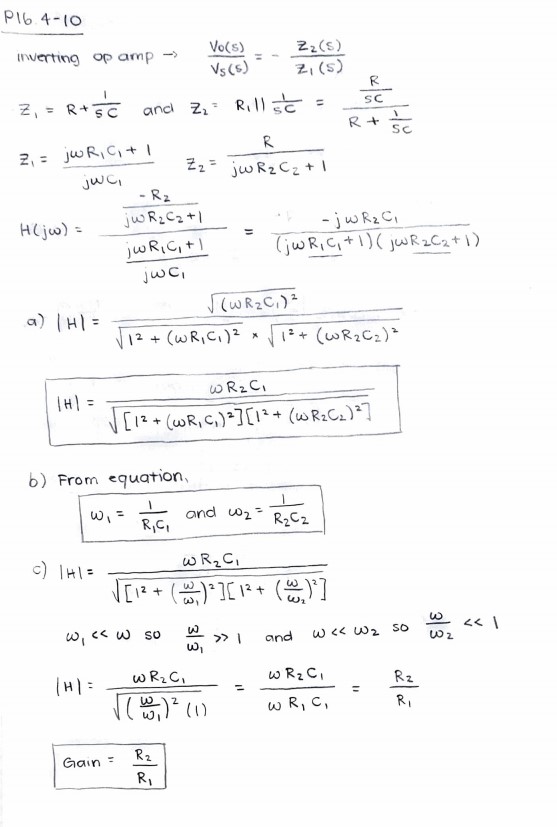
16.4-10
Solution,
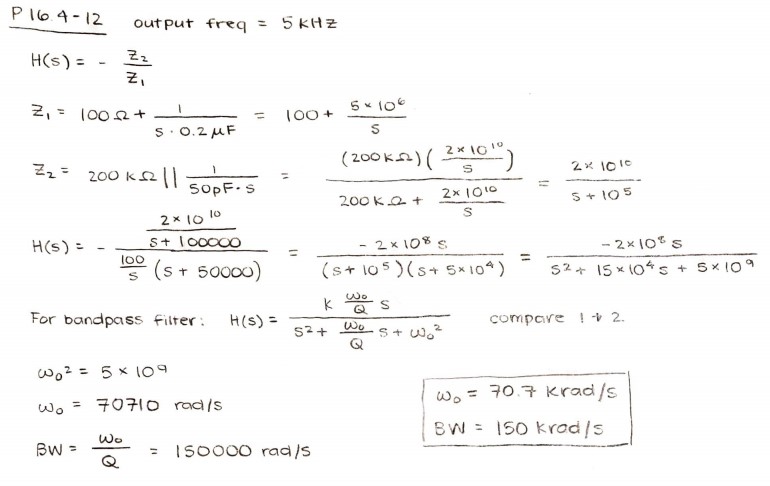
16.4-12
Solution,
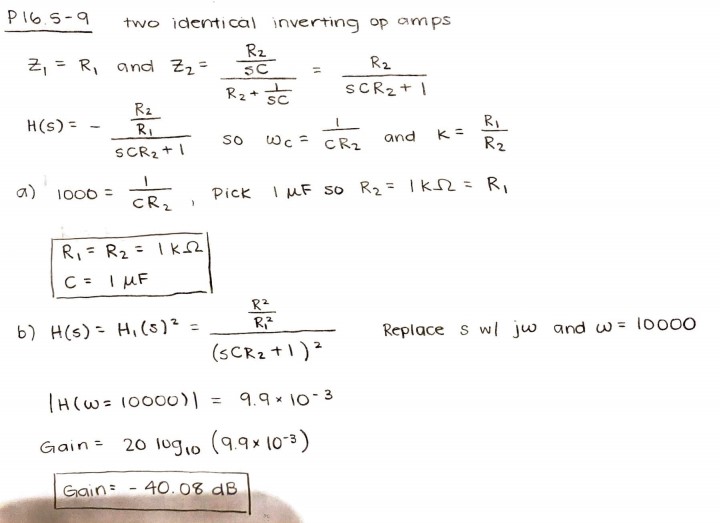
16.5-9
Solution
Project Items
This project primarily gets the students comfortable with measurement and resulting analysis of
second-order dynamics in linear circuits.
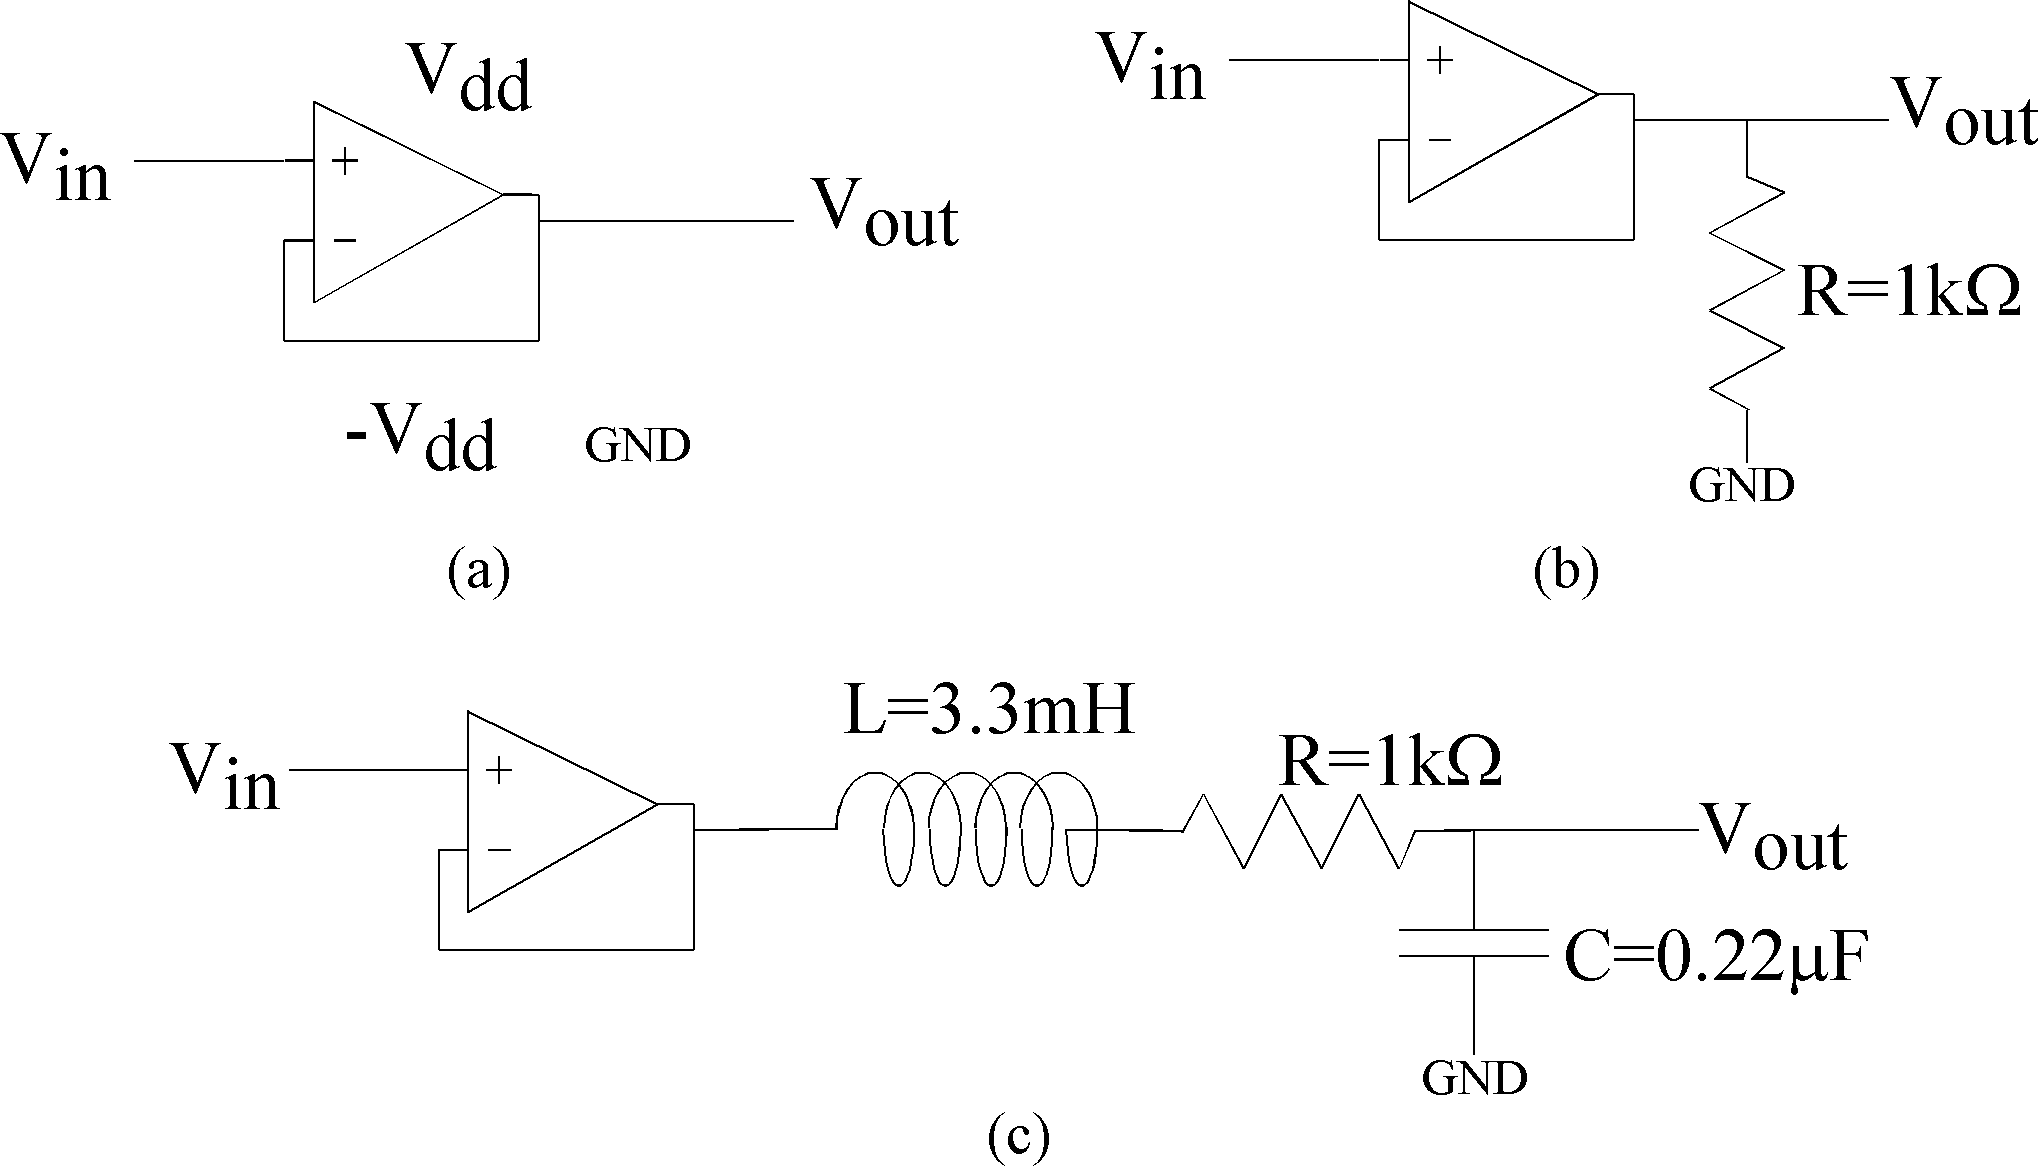
Figure 1: Circuits for lab measurement.
(a) Basic op-amp circuit being used as a follower circuit,
a circuit that has a gain of one.
This circuit isolates the circuit from the sourcing electronics.
(b) Test circuit to measure the follower circuit.
(c) RLC second-order circuit for this laboratory exercise.
- This project we will use the op-amp, but only as a buffer.
First, the op-amps, or at least approximations of them, are actually physical devices,
typically made from transistor circuits.
As you remember from class, an op-amp is configured as a buffer by connecting the - terminal
to the output terminal. Then the + terminal is the input, and the output terminal is the output.
The key is for your op-amp chip to find pins for the positive and negative inputs and output terminals.
Remember the circuit requires power supply pins. Either +5V, -5V or +15V, -15V will work.
You need to make sure the pinout you are using for your op-amp.
There are standards, but you need to know which one you are using.
Pin 1 is marked by stamp or mark near that pin.
081 series op-amp is a single op-amp in a package.
The inputs are on pin 2 (-) and pin 3 (+), and the output is pin 6.
Vdd+ is pin 7 and
Vdd- is pin 4.
082 series op-amp is a dual op-amp in a package.
Vdd+ is pin 8 and
Vdd- is pin 4.
The inputs of op-amp 1 are on pin 2 (-) and pin 3 (+), and the output is pin 1.
The inputs of op-amp 2 are on pin 6 (-) and pin 5 (+), and the output is pin 7.
- Validate your op-amp circuit setting up a circuit in Fig. 1b, and measure the
output voltage as a function of input voltage. Find the slope through a curve fit and include a plot with
these details. Explain any other aspects you might notice (e.g. offset).
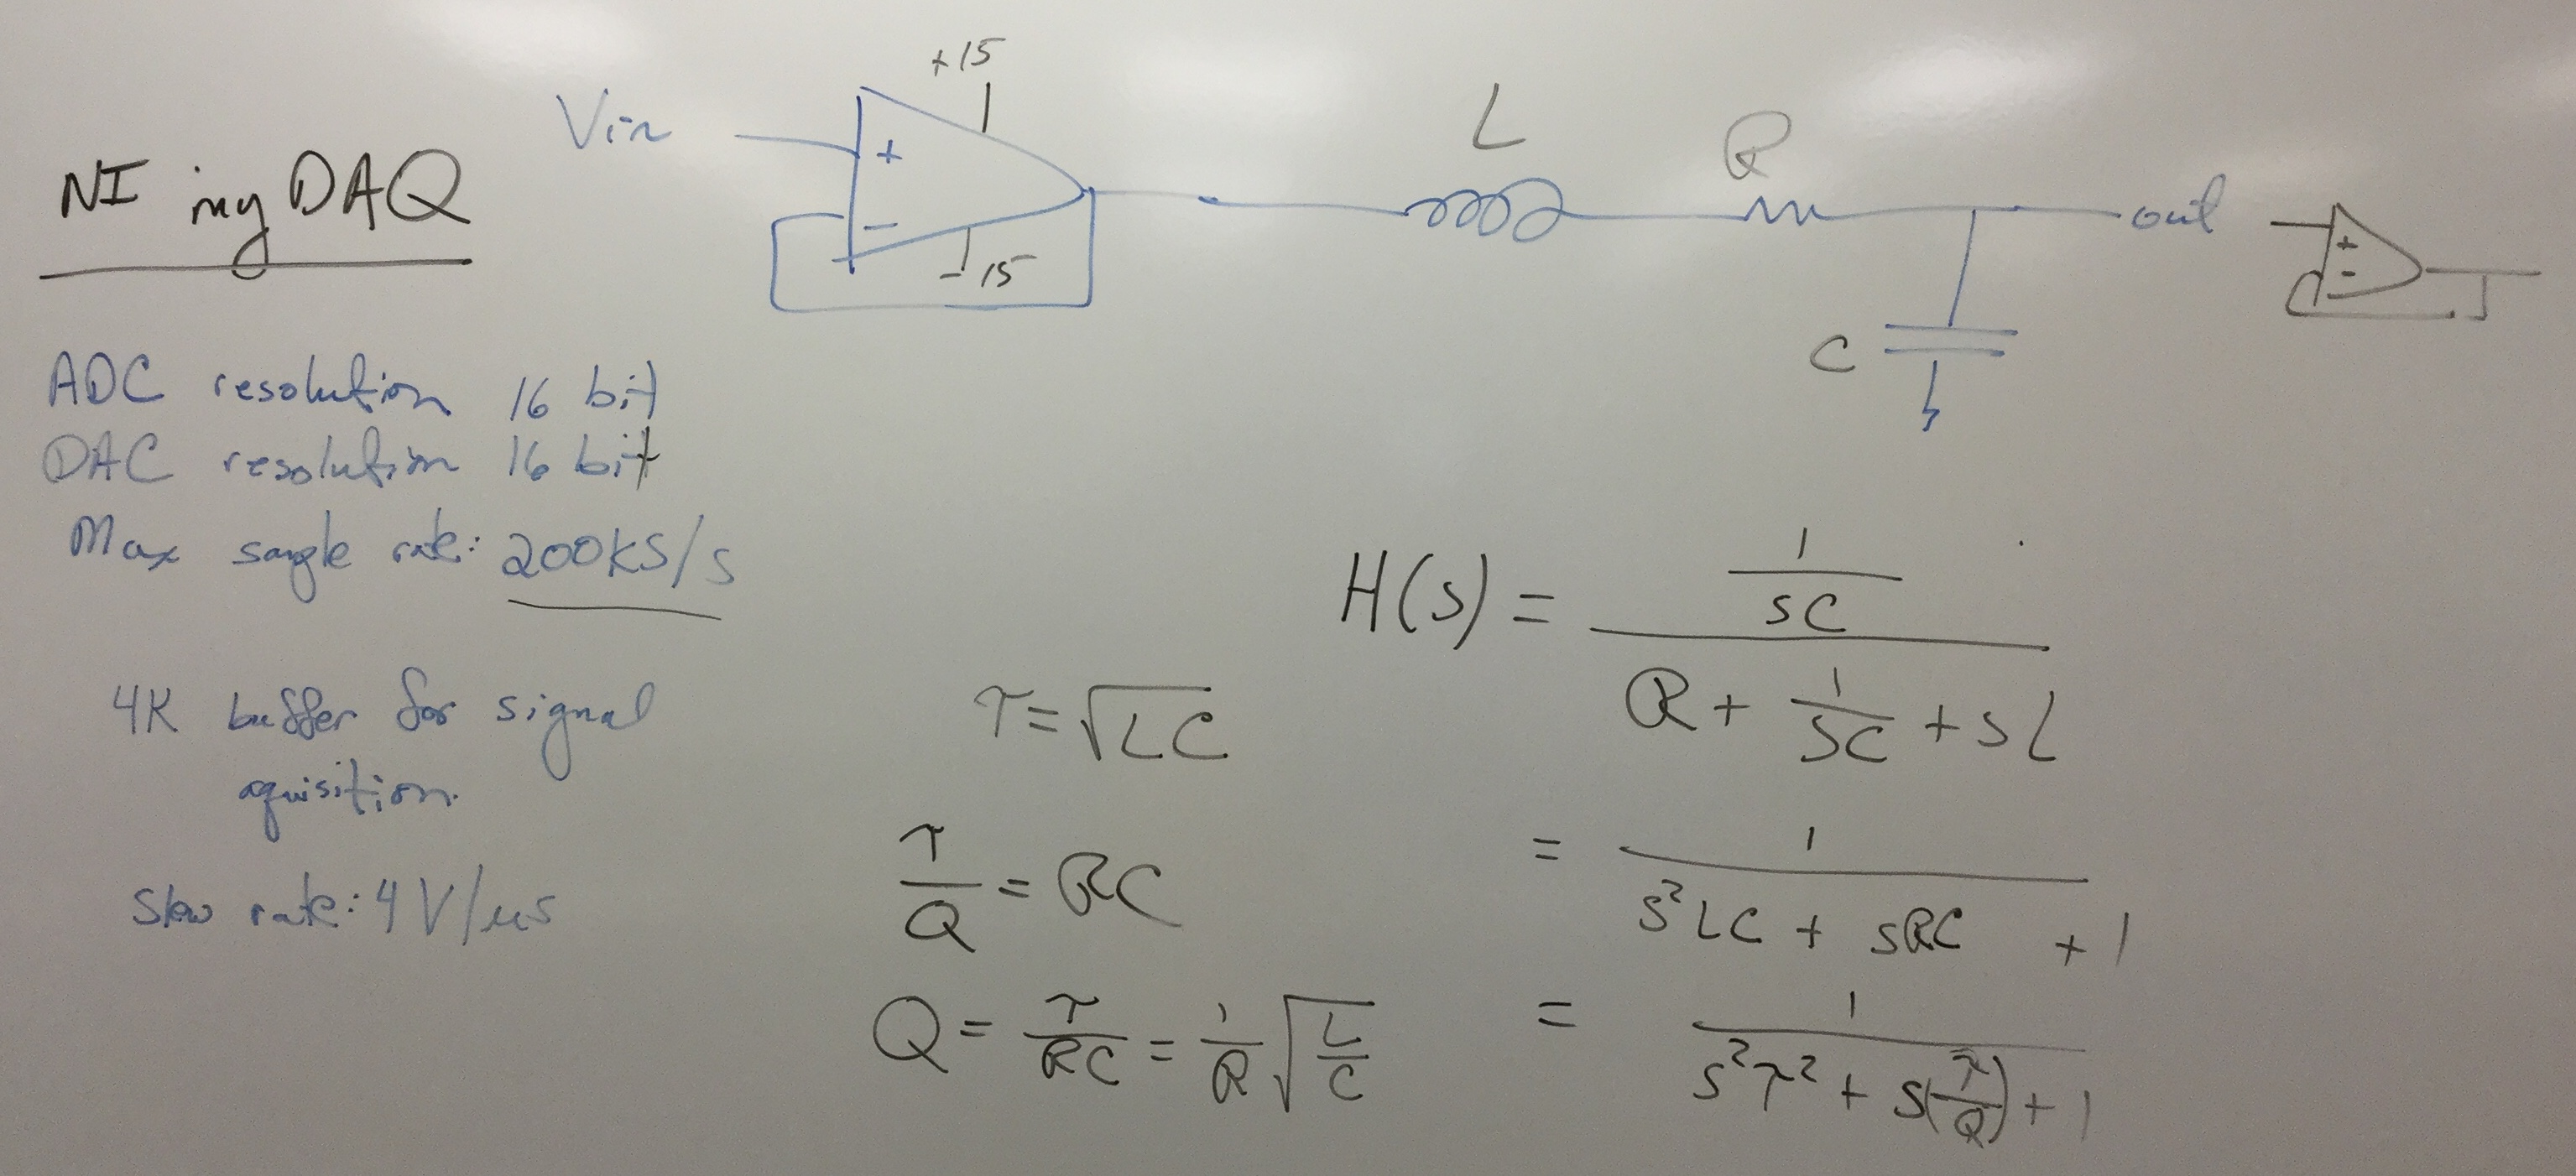
- Set up the second-order filter circuit in Fig. 1c. We will use this circuit for a number of
experimental measurements. A short test of this circuit would be to notice that the output is
nearly equivalent to the input.
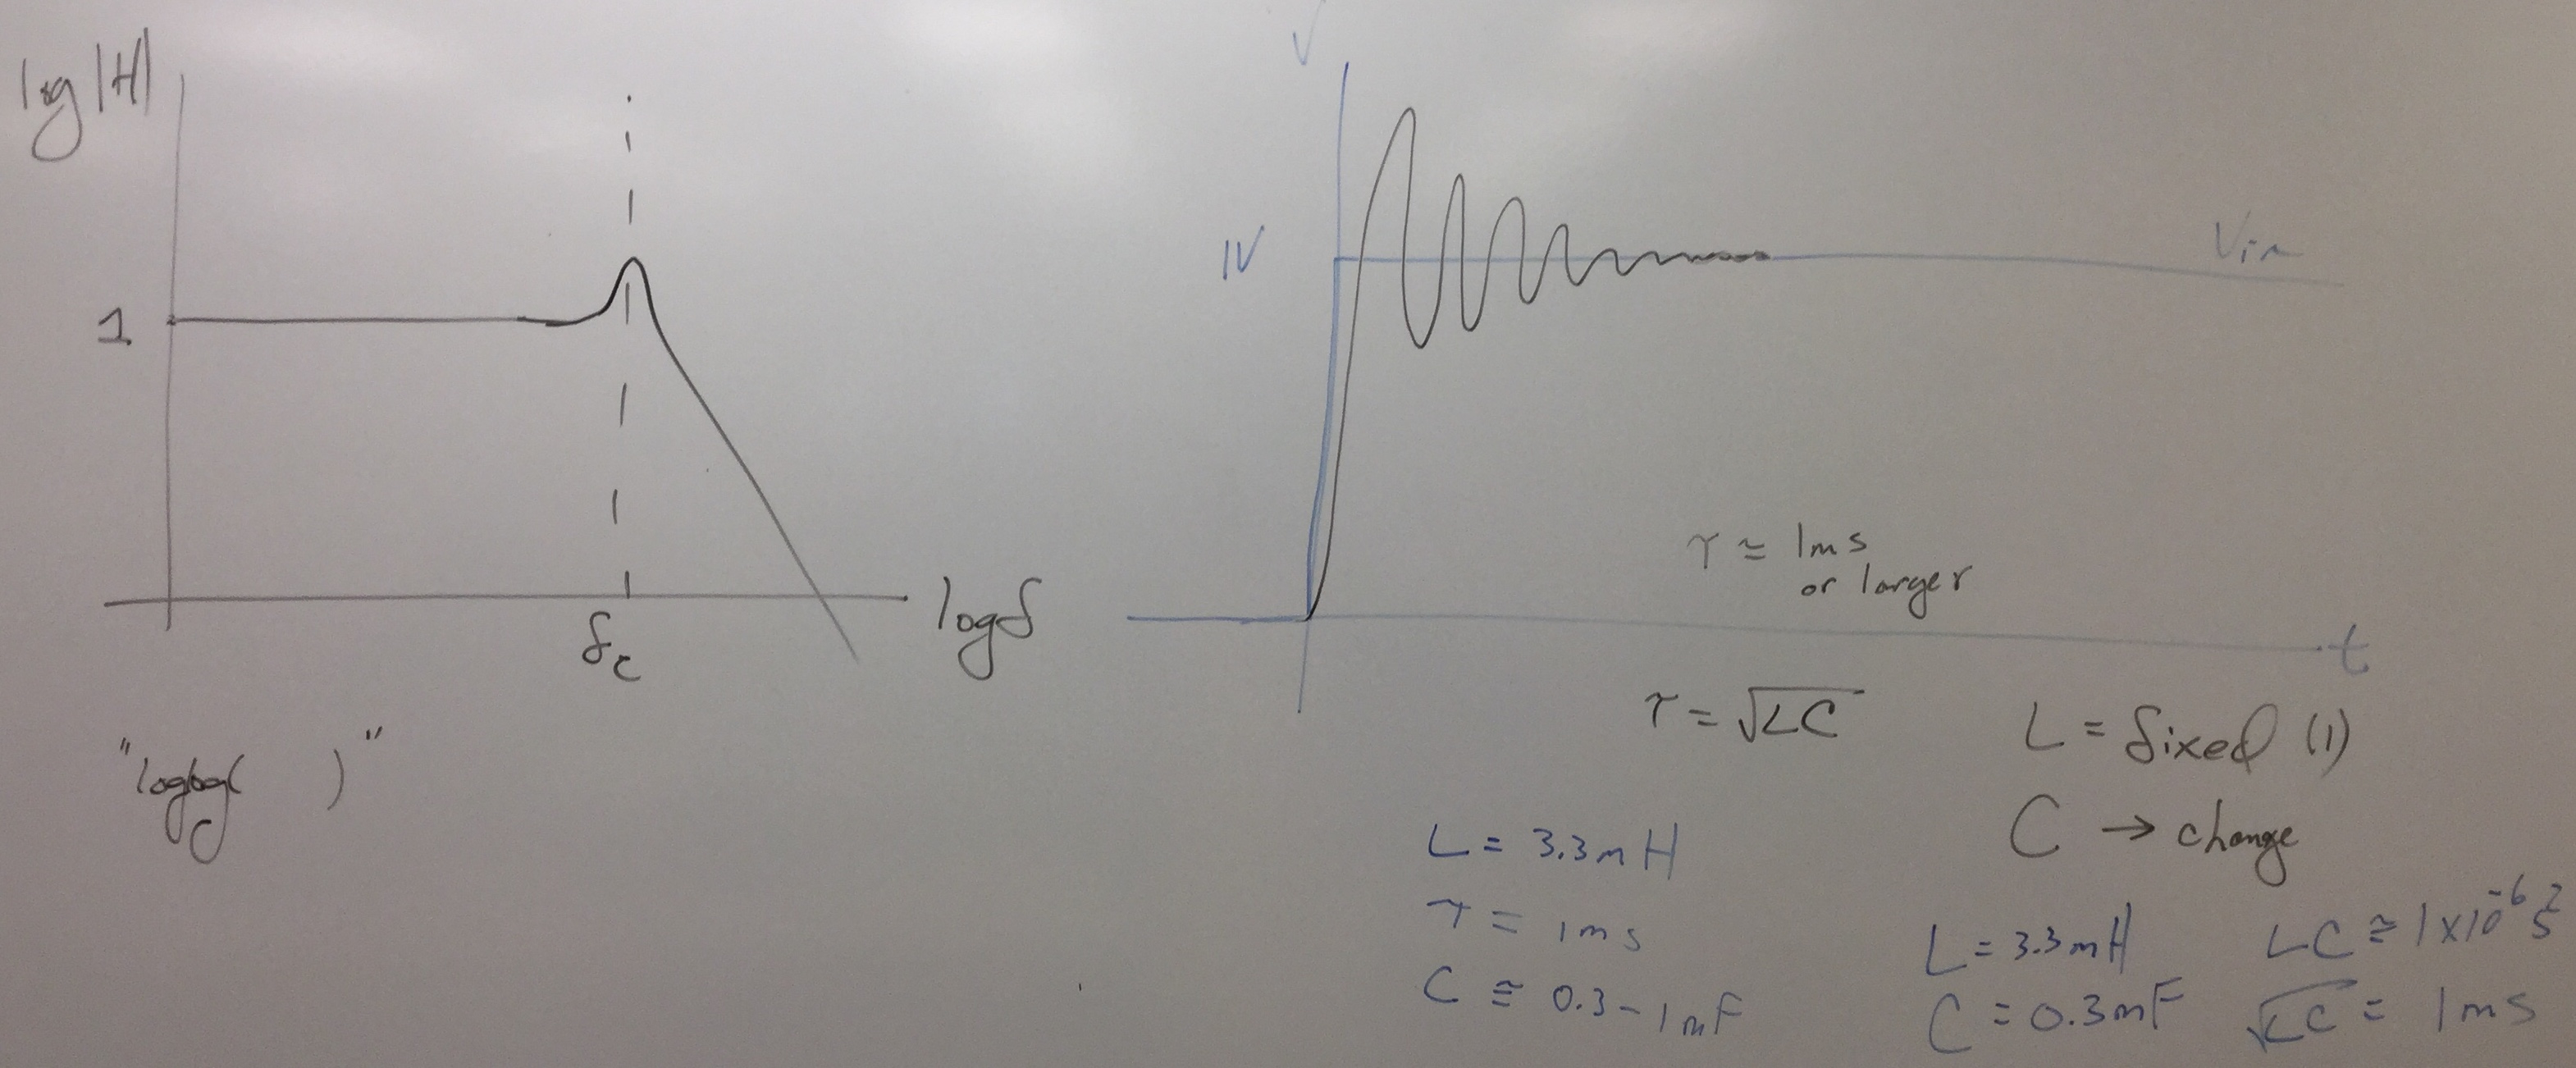
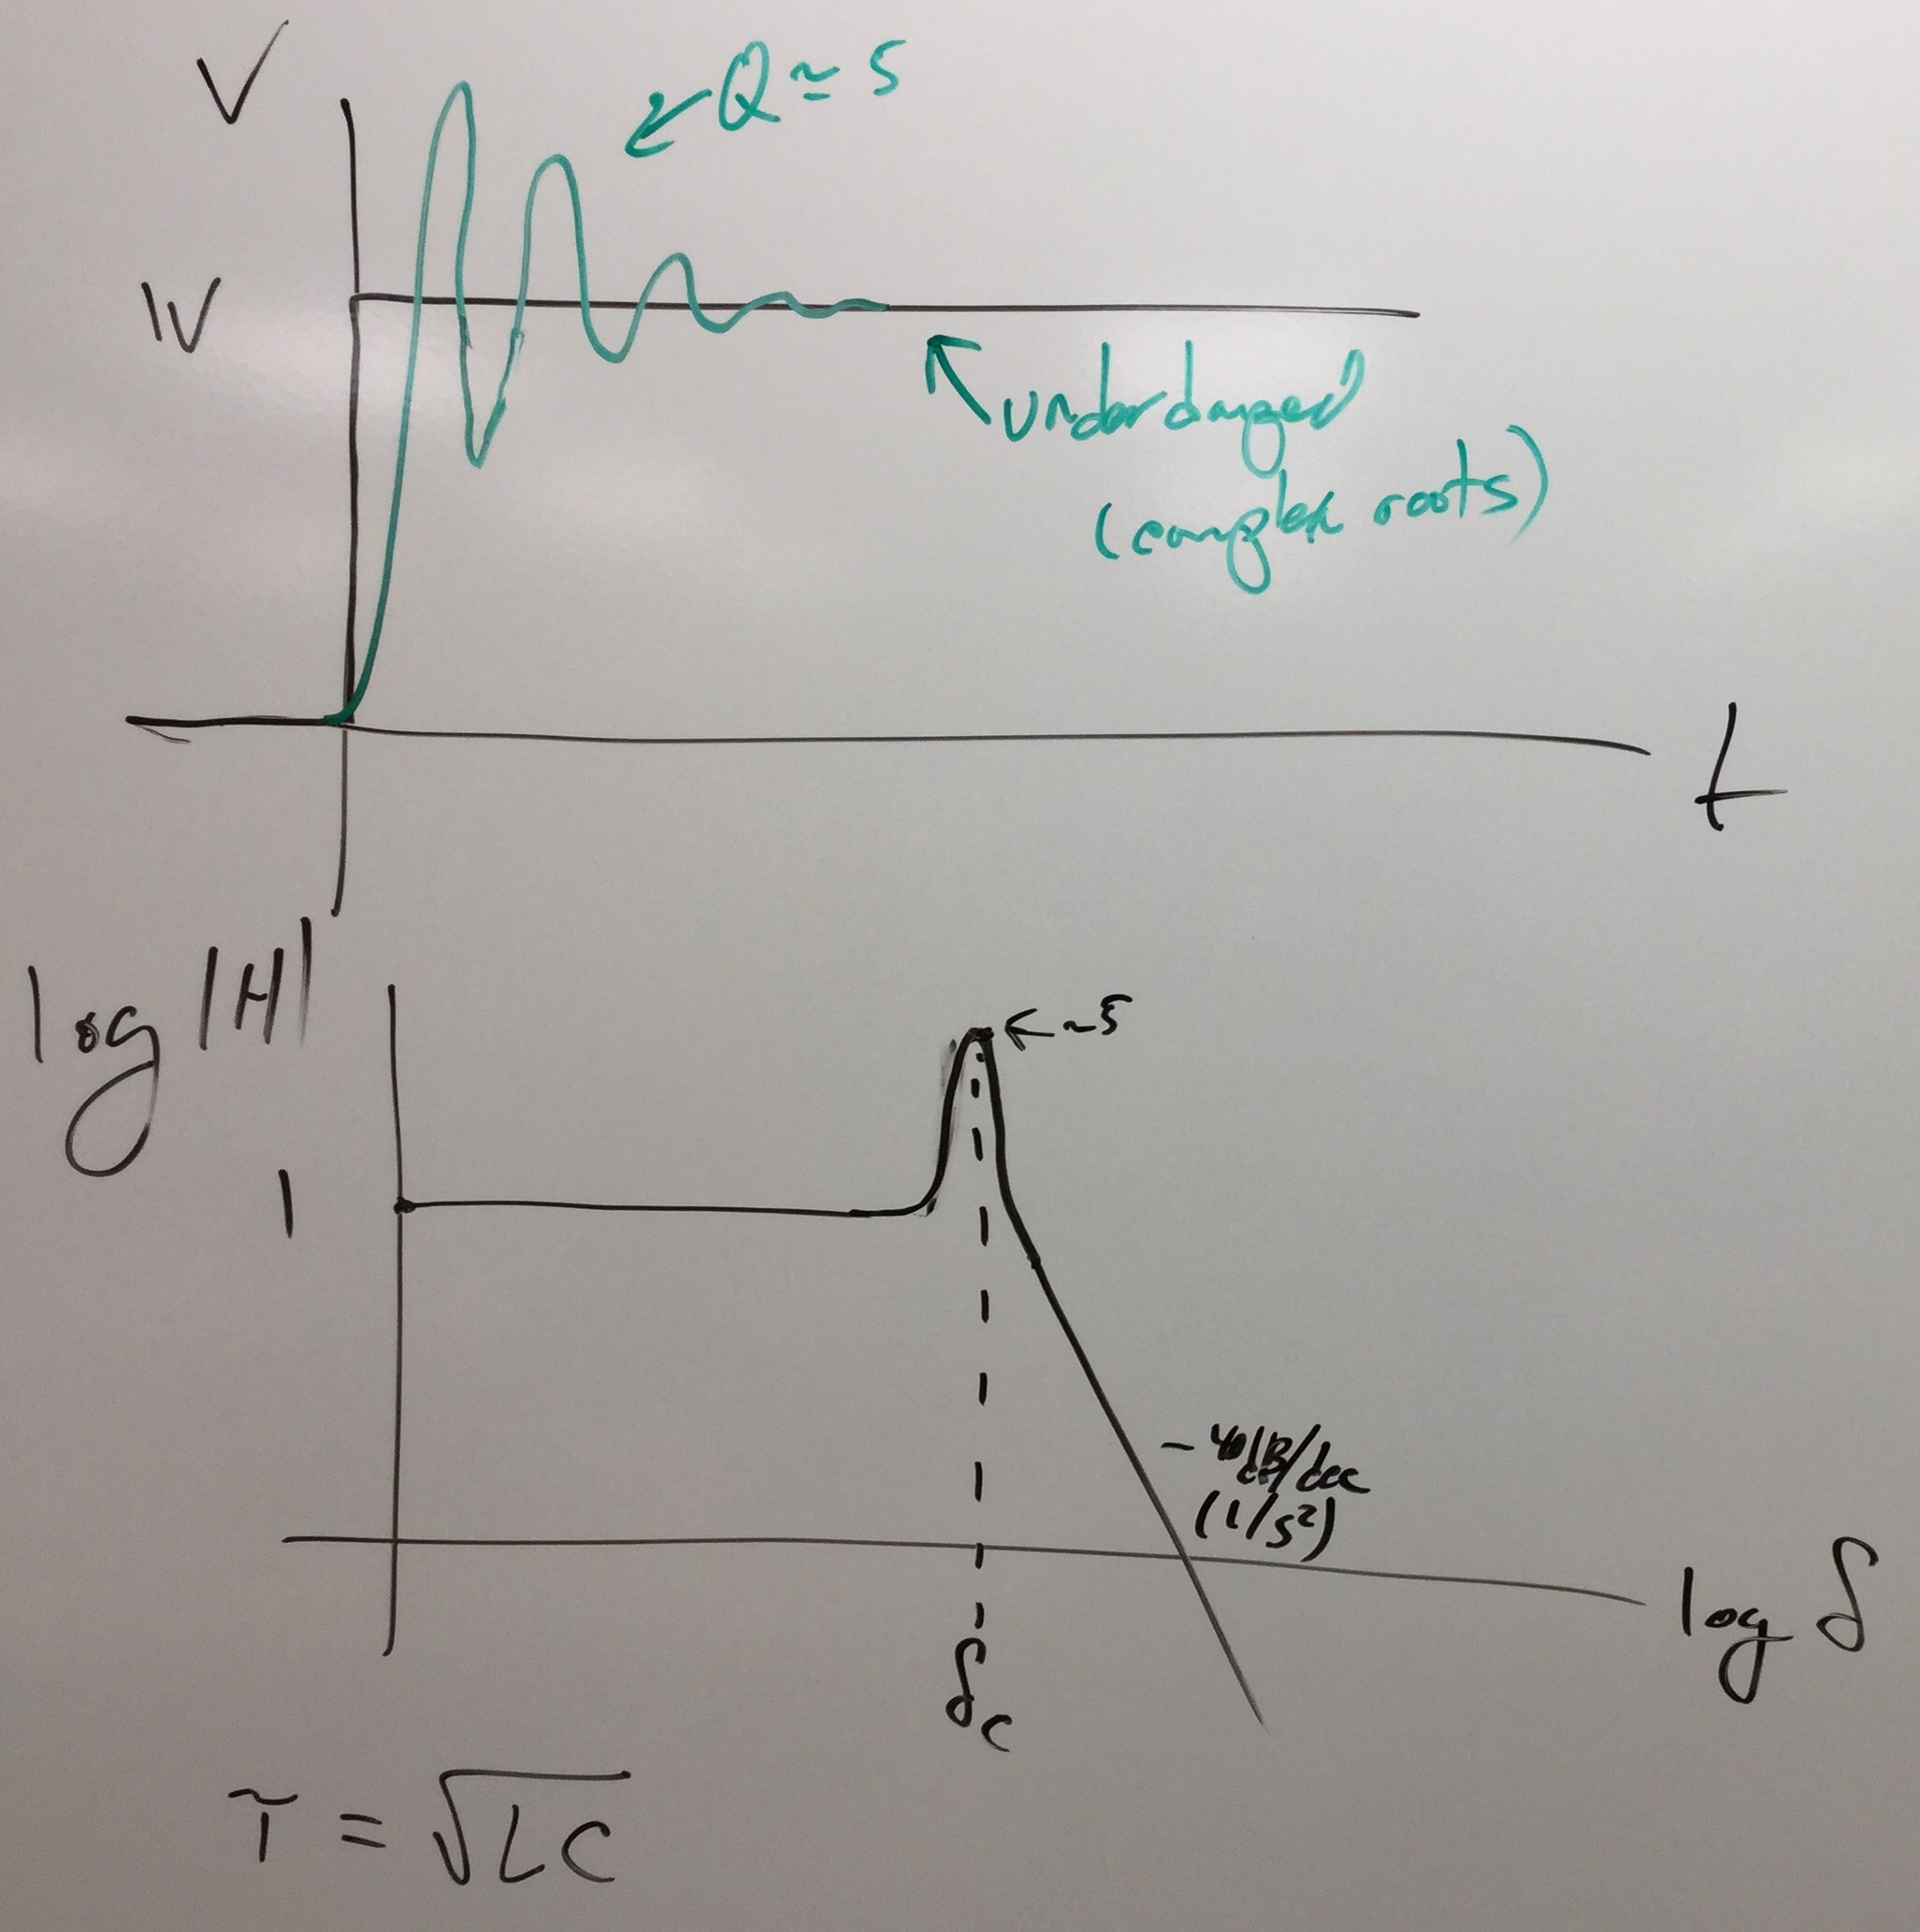
- Start by measuring the step response of this circuit.
Having an input step from 0.5V to 1.5V would be appropriate.
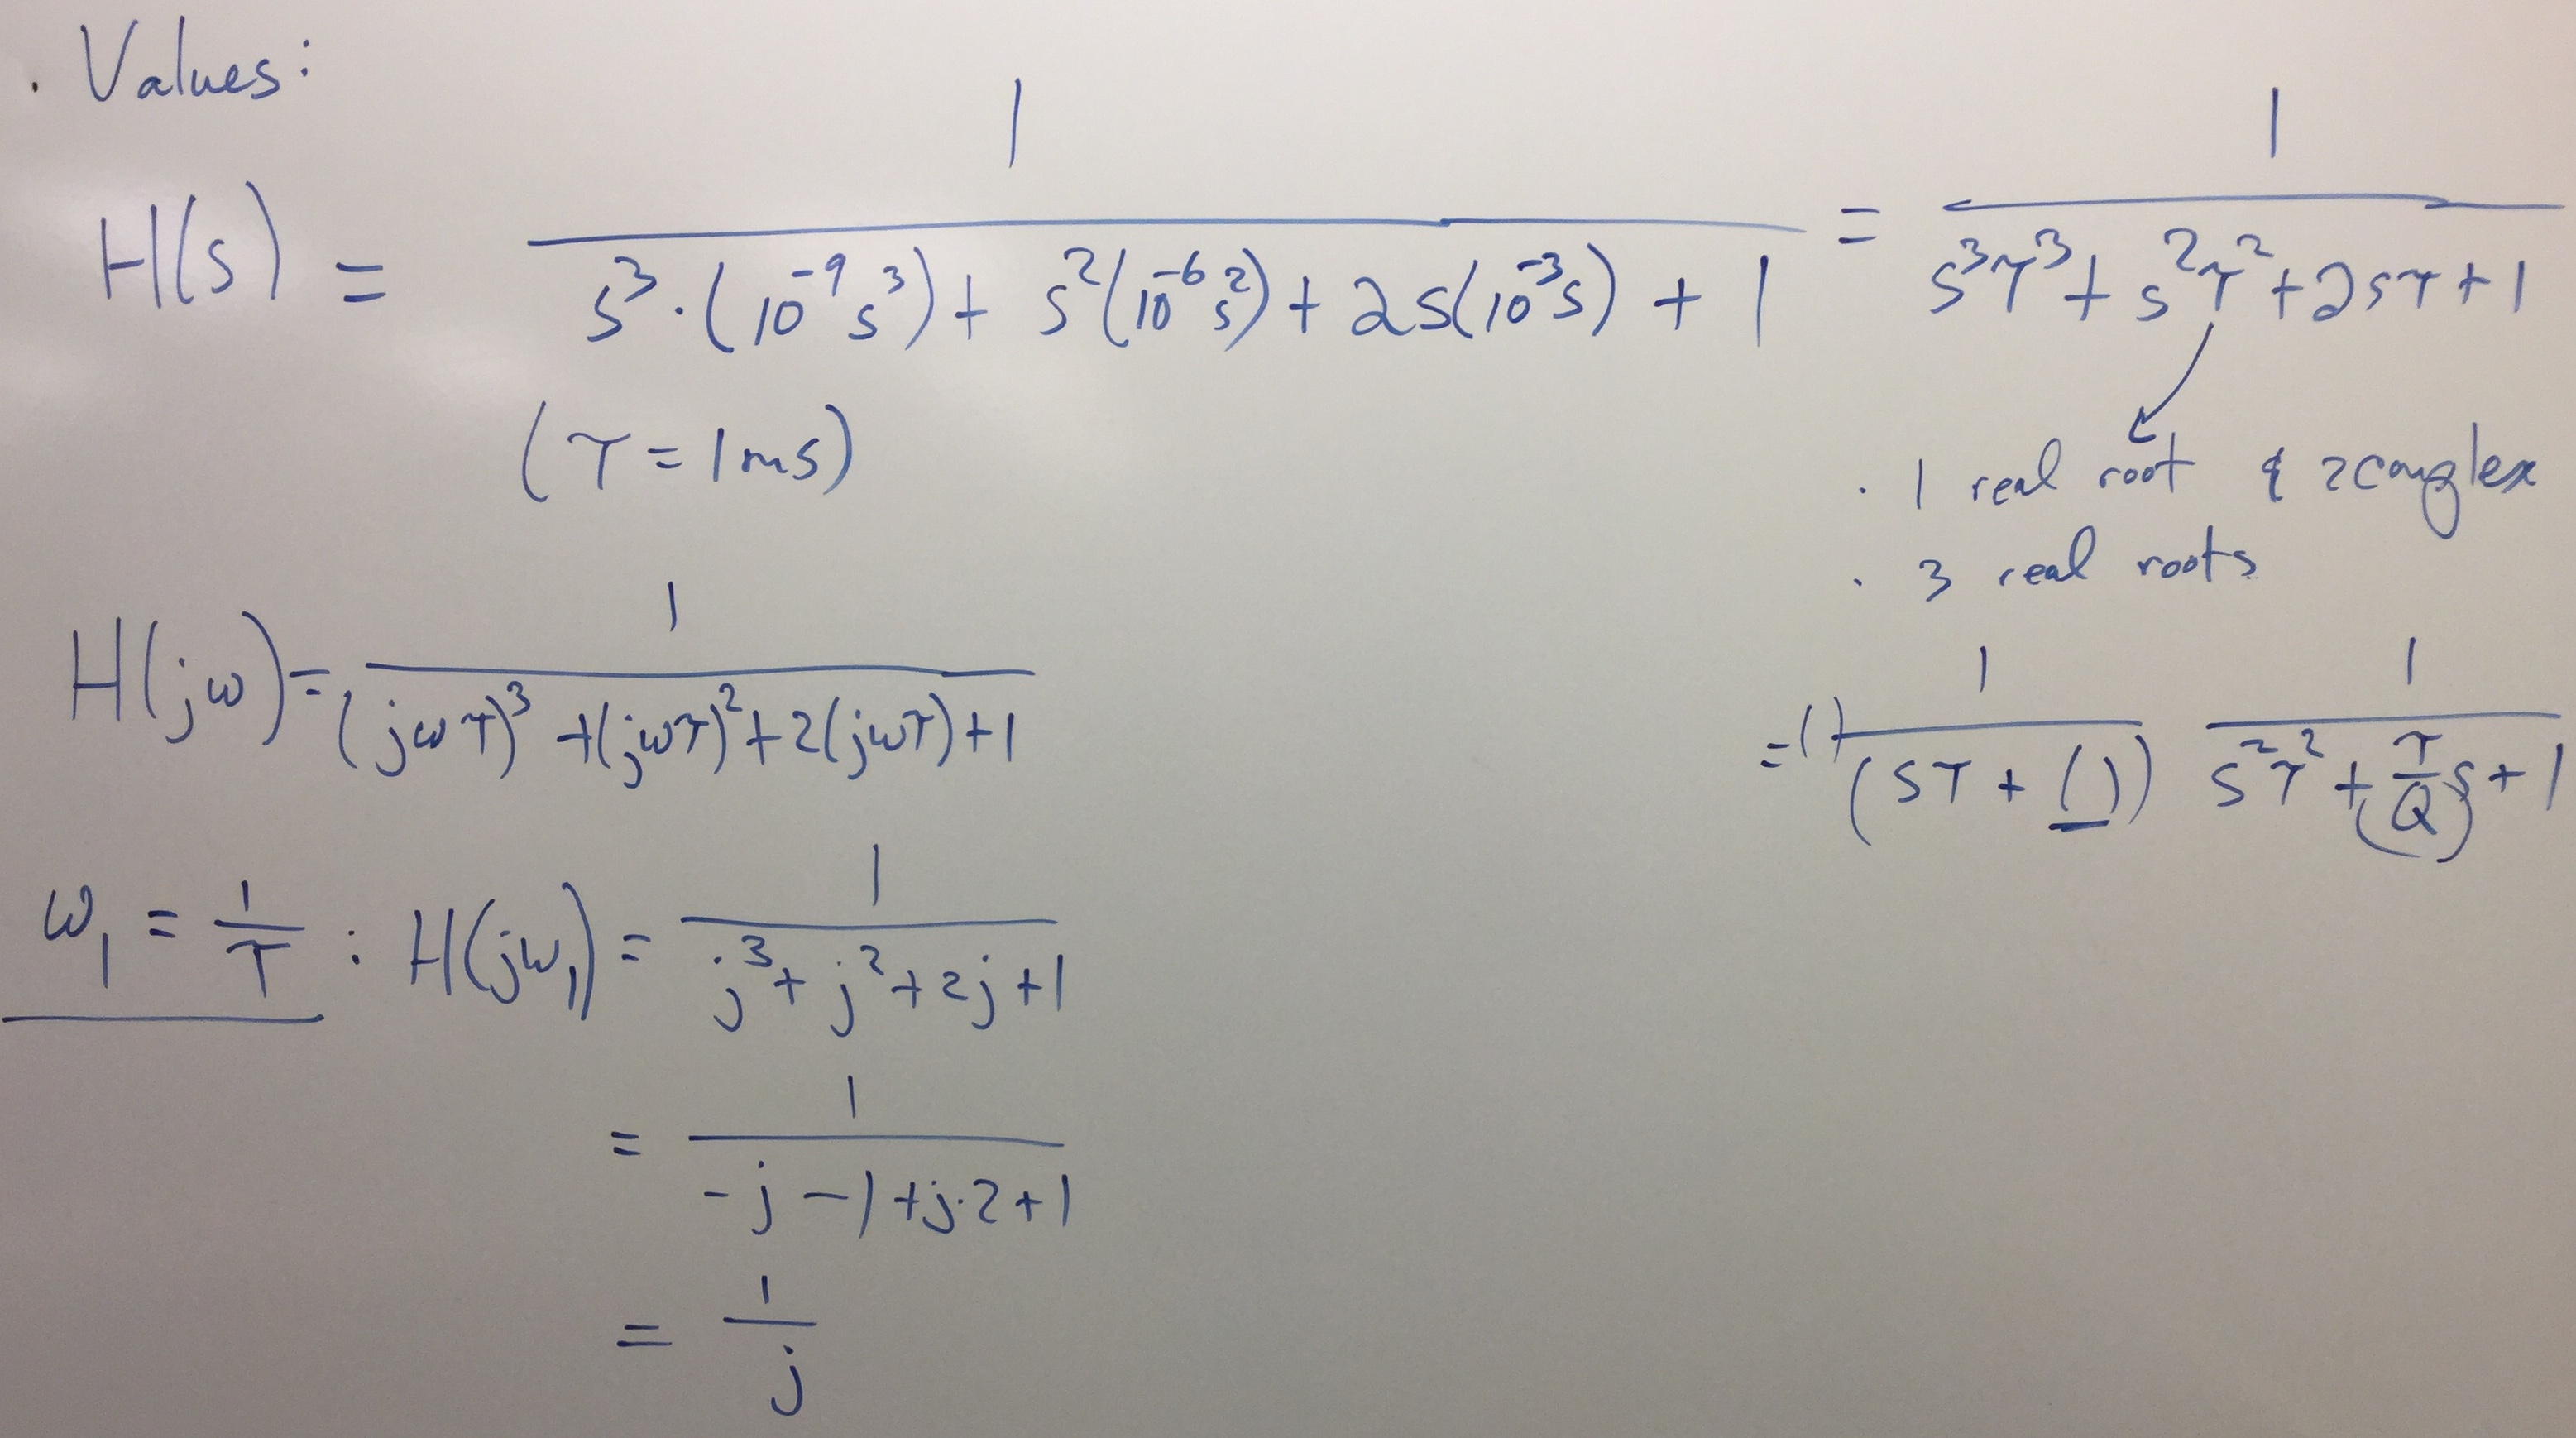
Are the roots of this physical differential equation real or complex? How do you know?
What are the roots or center frequency and quality factor?
On the plot, identify key regions of this graph.
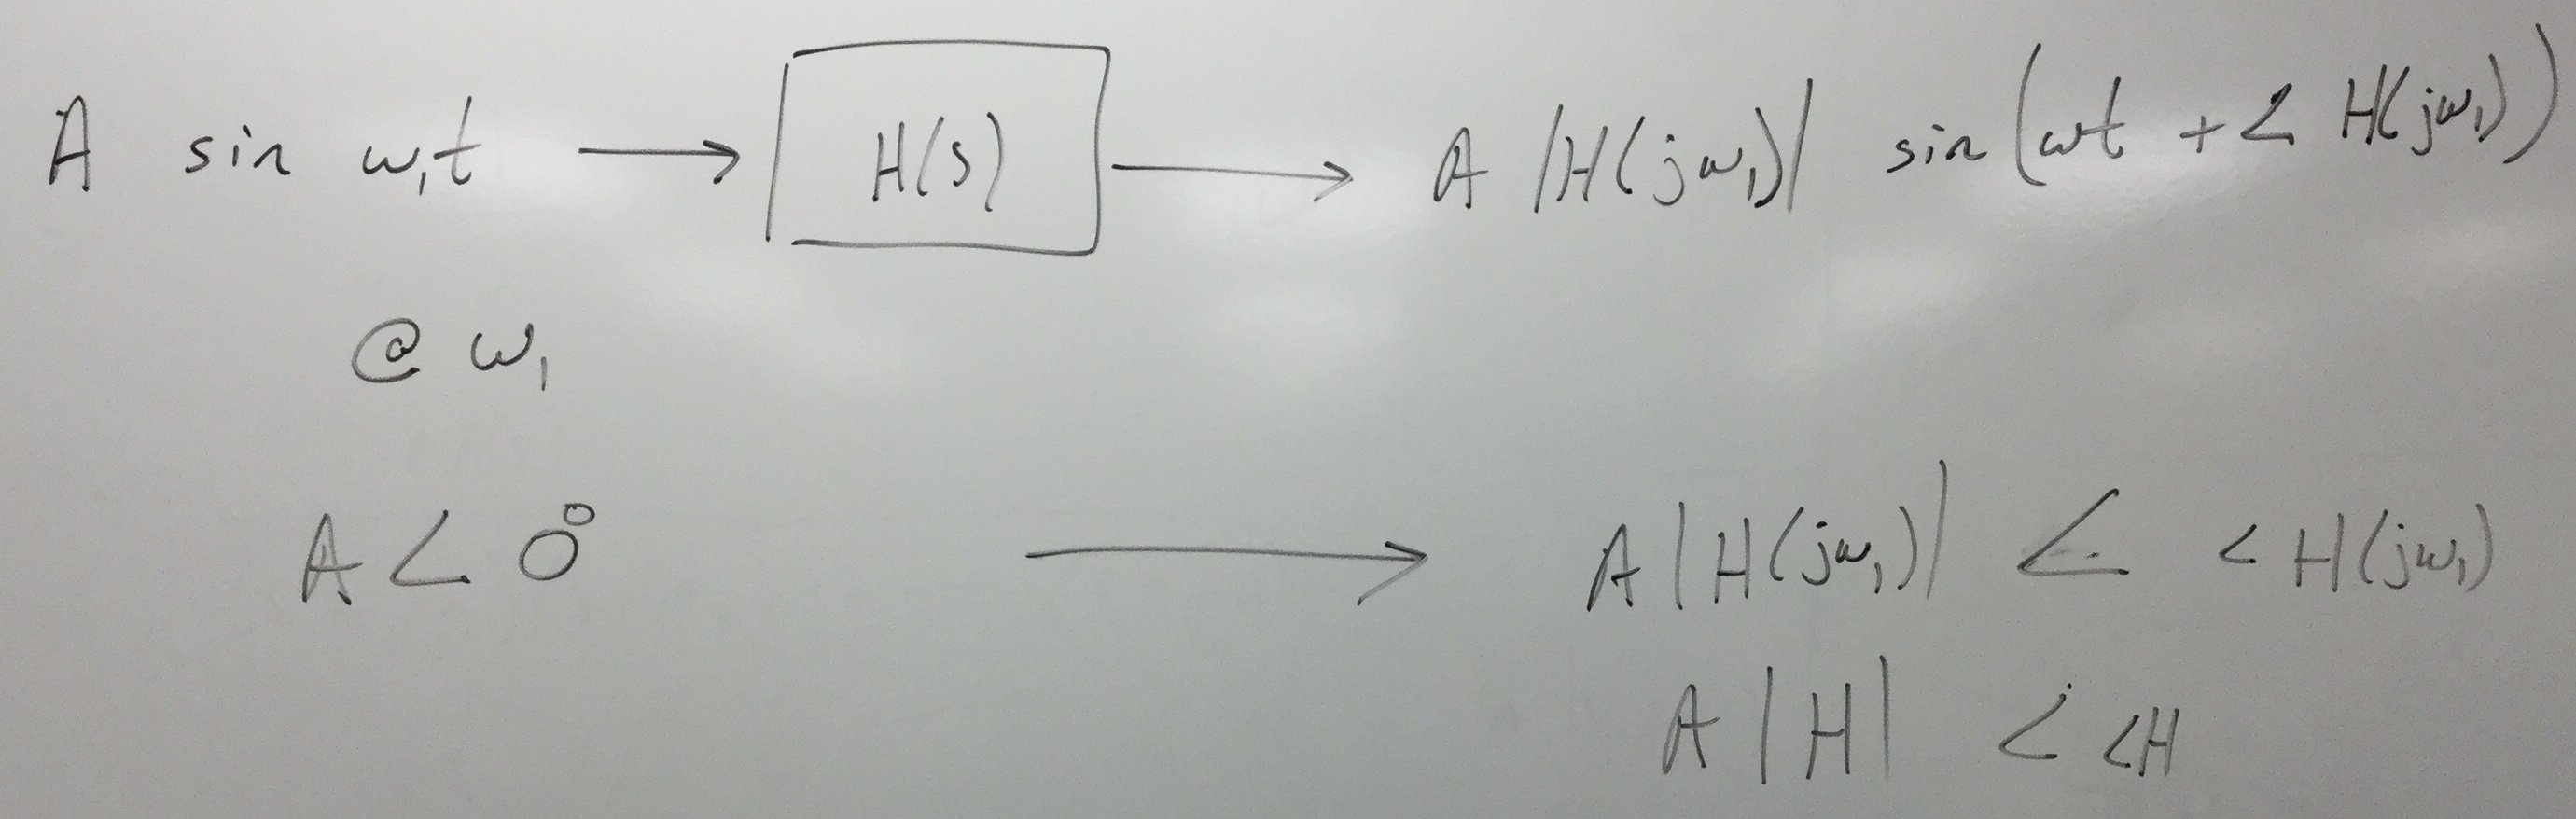
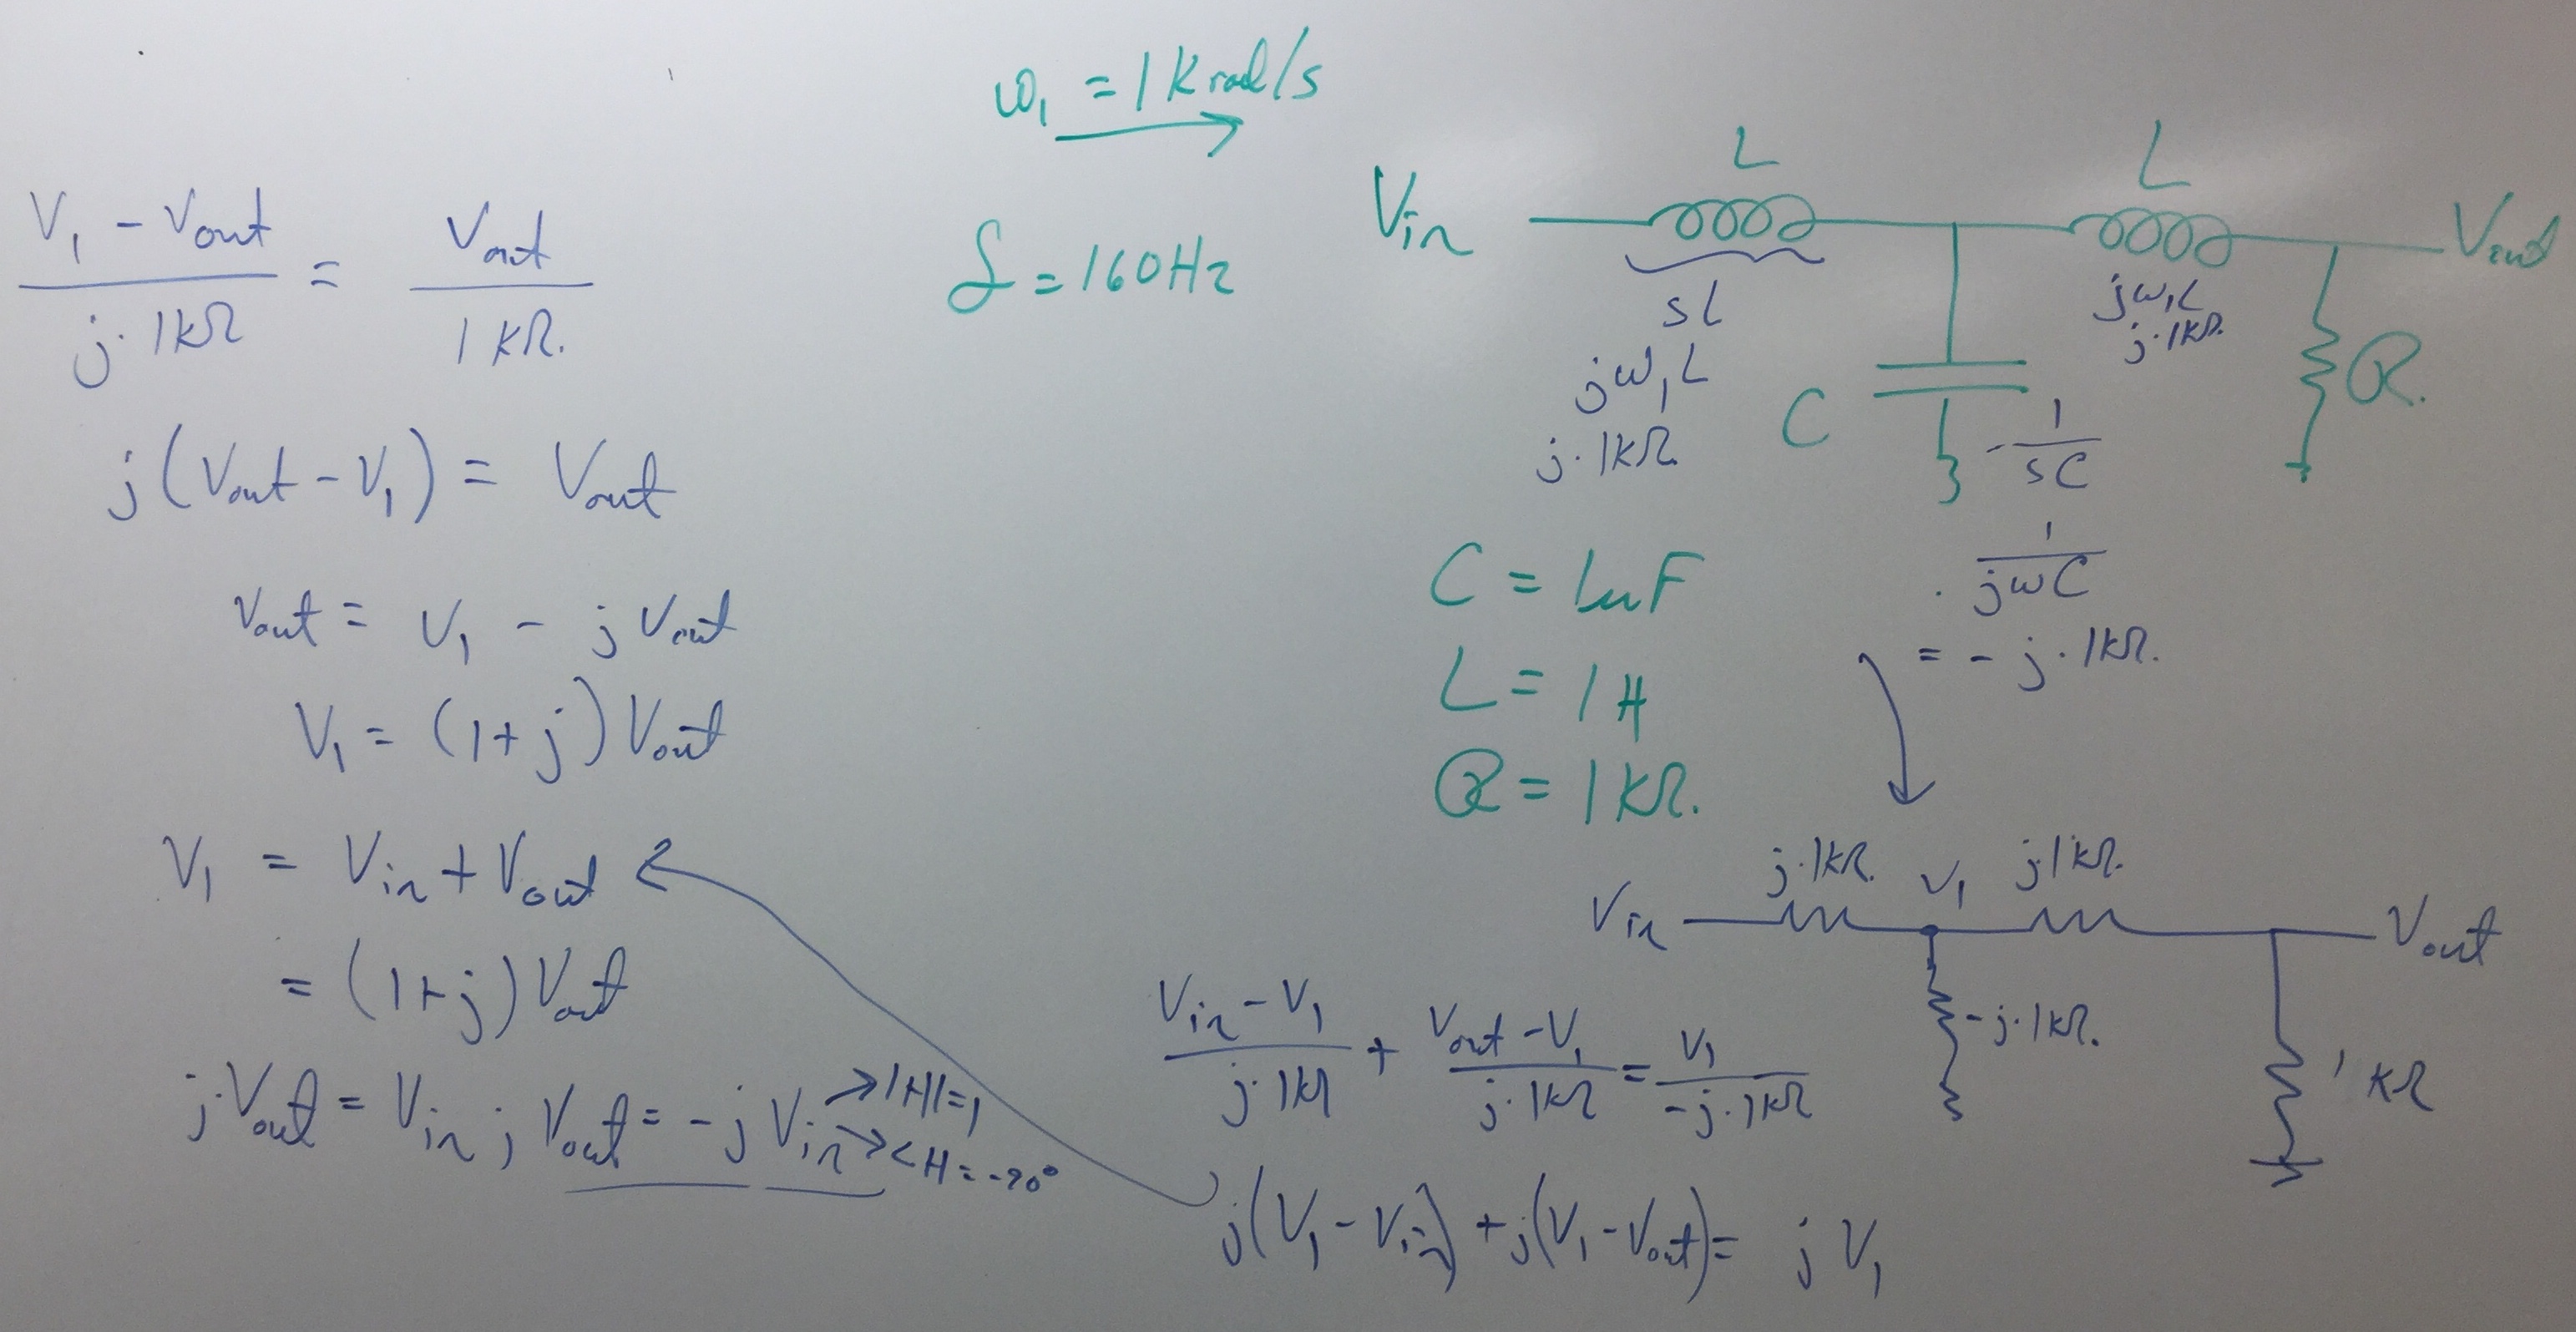
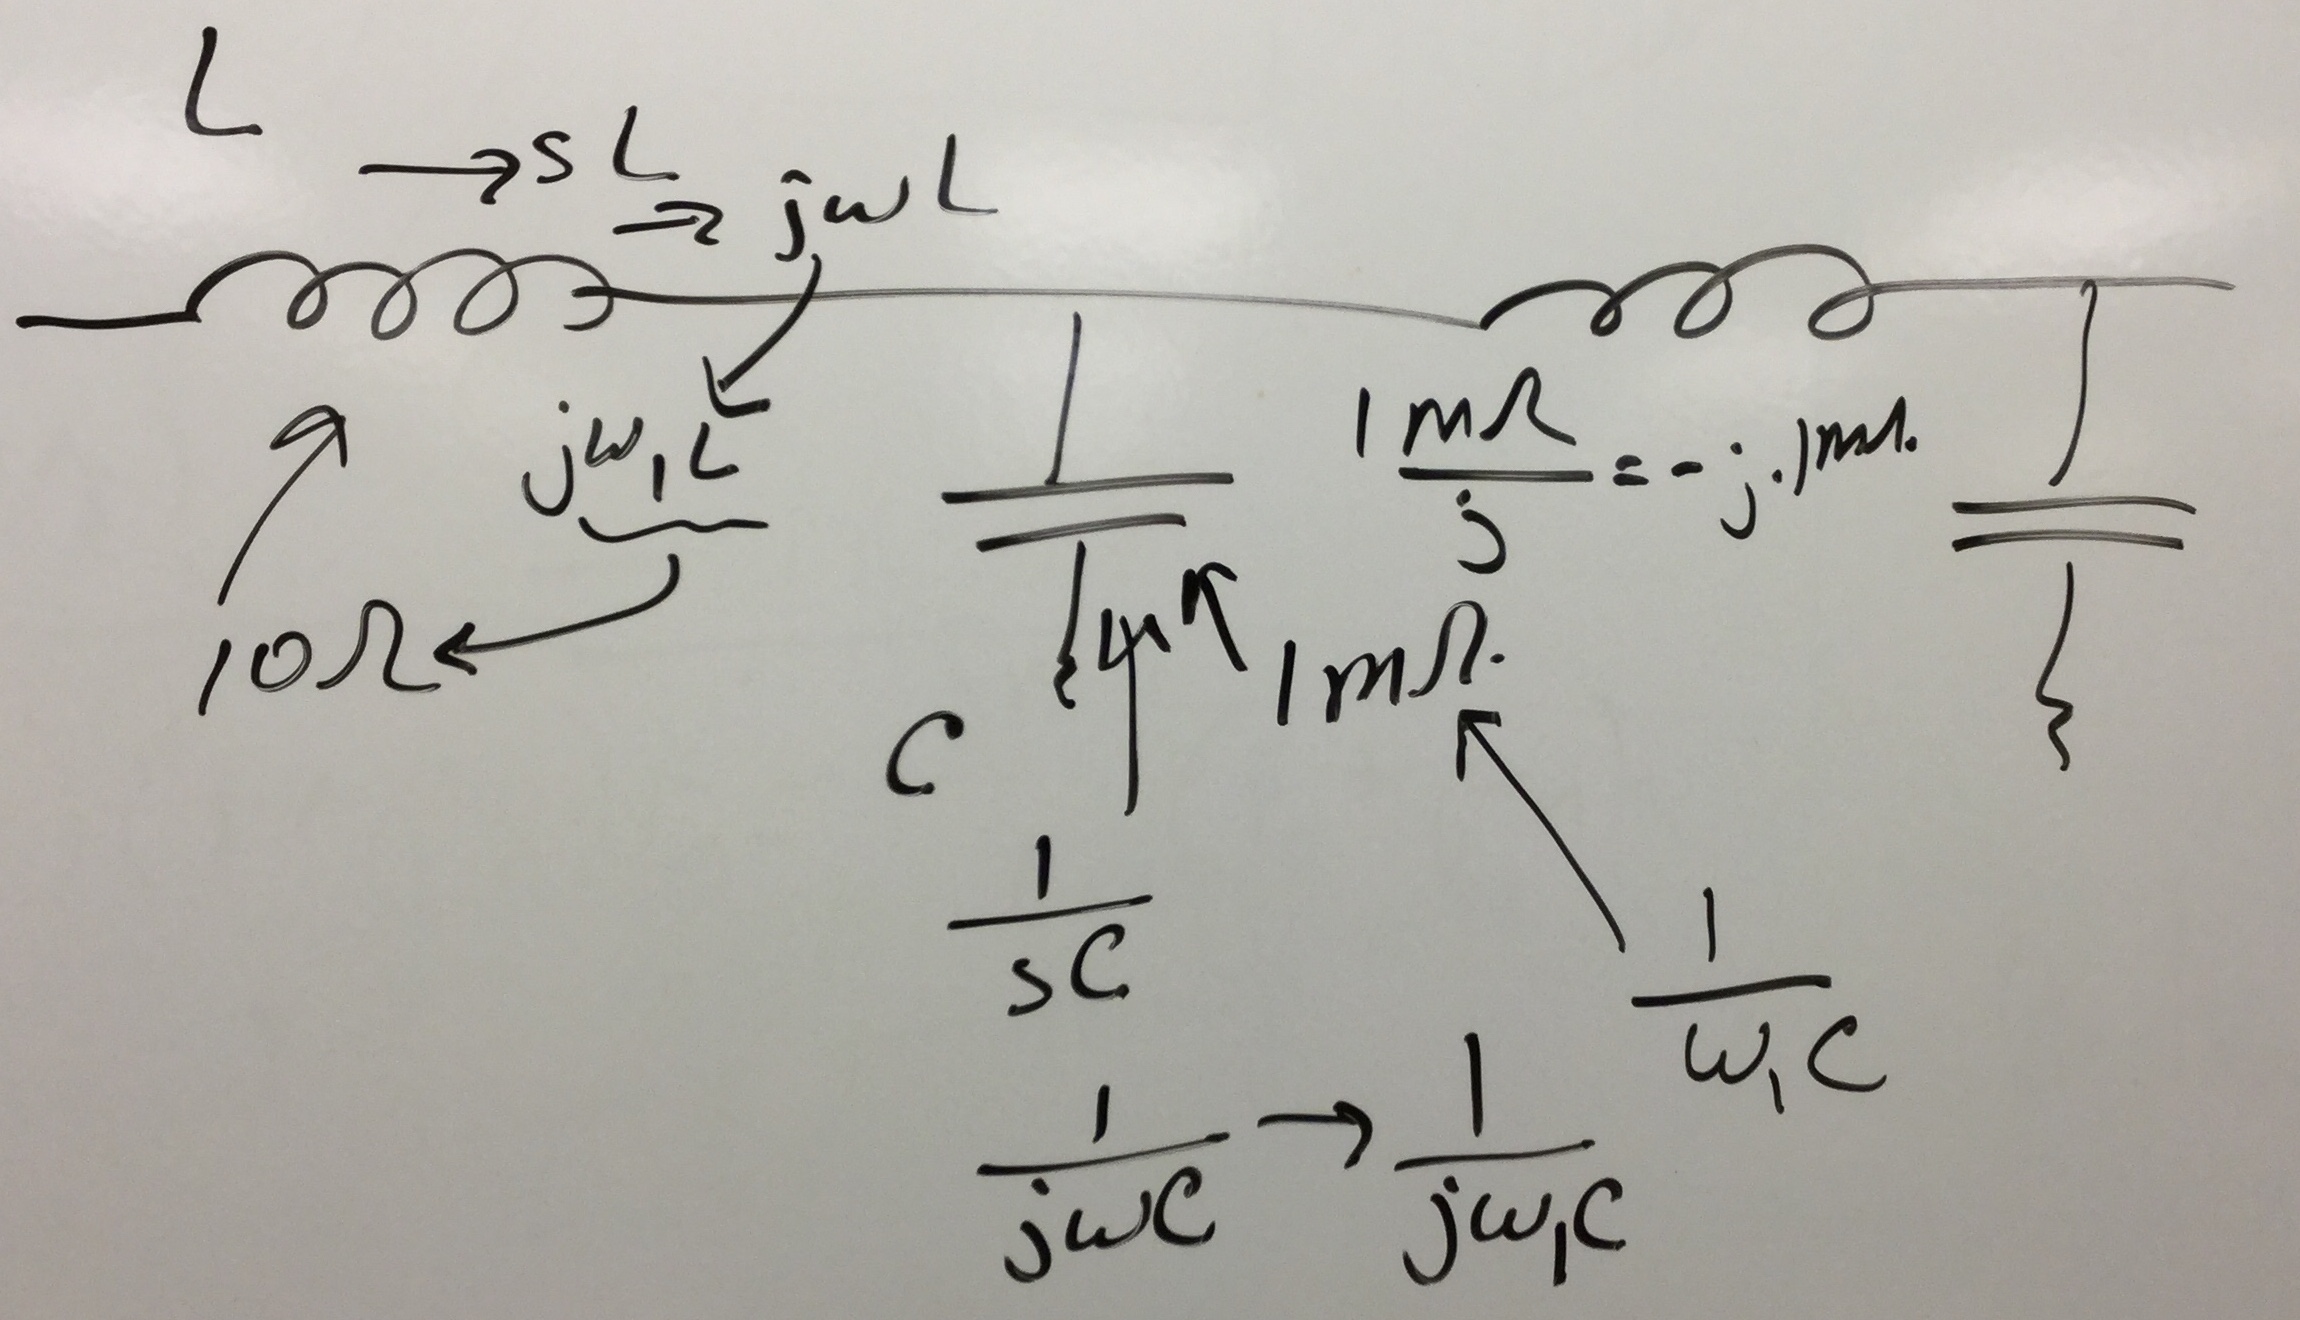
- Frequency response .
First, choose a single frequency near the center frequency and show the resulting sinusoidal output
and input signals as a function of time.
You might want to try a couple of different frequencies to see the difference and see the amplitude and phase changes.
Take a frequency response of this circuit. The tool will have an automatical way of inputing a sinusoid
of one frequency, and measure the result with some accuracy.
You need to find the right frequency for sweeping the frequency to optimally see the dynamics.
Compare the results of this graph,
and find center frequency and resonance from the graphs.
- Next, we will take two additional curves.
You will want to look at the behavior initially as step responses,
and when we have a good step response, we should take a frequency response.
In one case, replace the 1KOhm resistor with a 50Ohm resistor.
In the second case, replace the resistor with two terminals of the trimpot,
and tune the pot to see different responses.
Have fun moving through the different step responses.
Have all frequency responses (3 together; if more than three, maybe they could be in two curves)
that show the effect of changing R while keepin L and C constant.
Compare center frequency to L and C.
- A previous year
( Spring 2019 )
lab experiment and two good examples
(a and b)
of writeups to these experiments. I am not saying these writeups were perfect,
and yet they were good examples of the better writeups for that semester.
|