Topics
These are the core topics for Unit 1.
These topics are what what would be covered in the exam for Unit 1.
- Basic linear circuit elements
- Basic Circuit Analysis
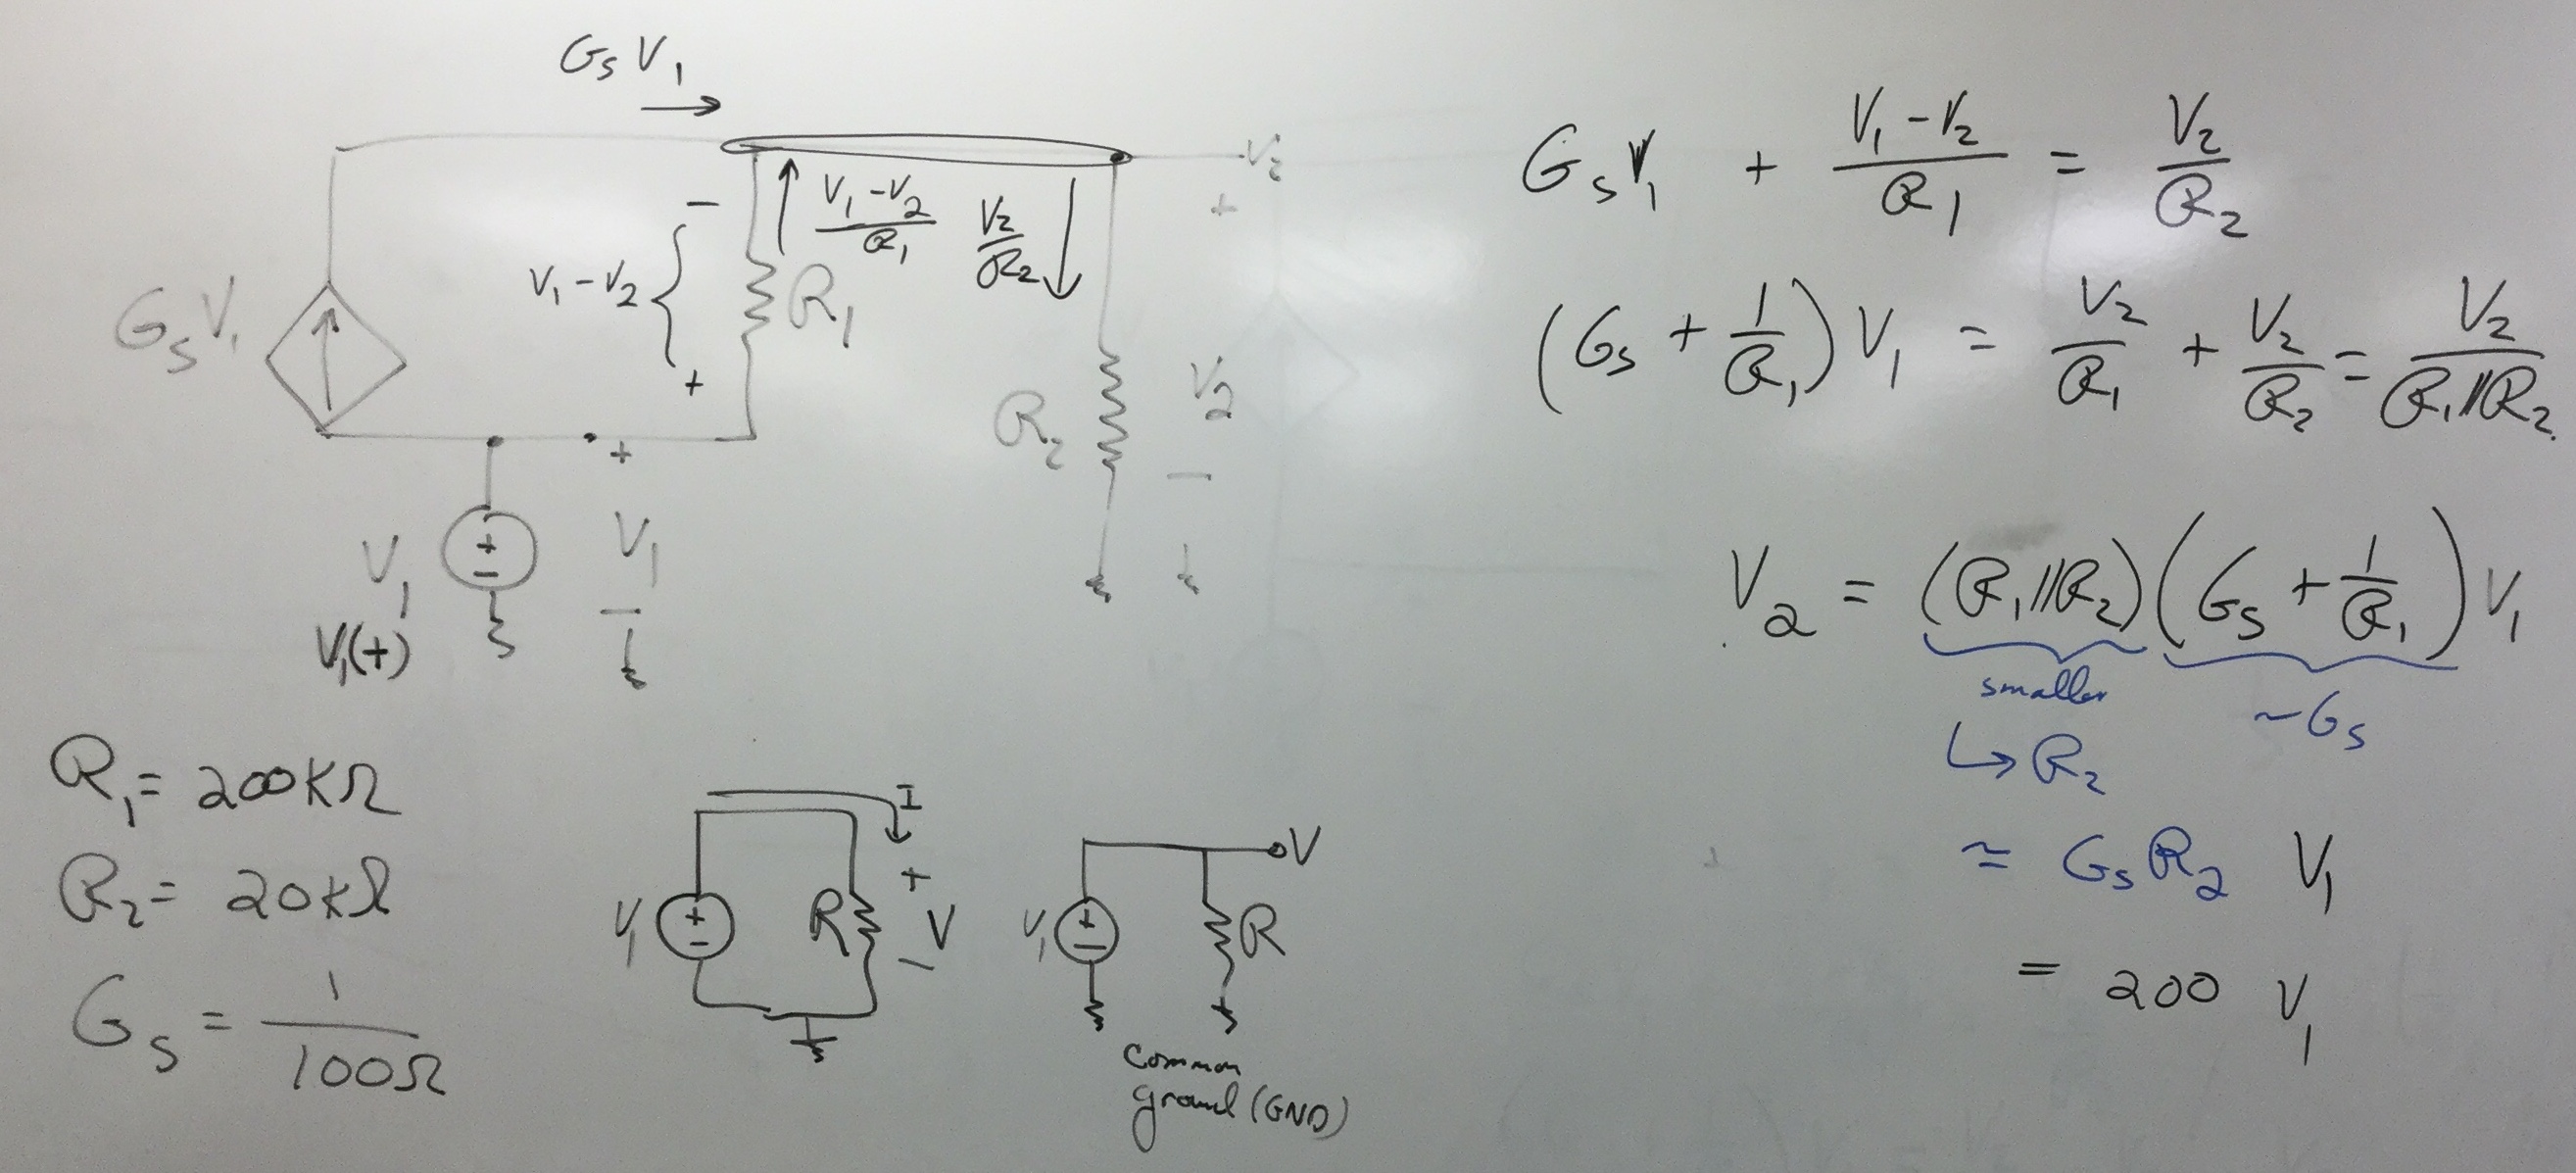
- Resistive Circuits with independent and dependent sources
- Superposition, Symmetric Circuits
- Thevenin--Norton Equivalents
An equivalent
slide
for preparing for the exam
Class Schedule, Topics, Taped Lectures
The particular taped lectures should be watched before class session.
My photographs of the lecture boards will be posted soon after all lectures are finished.
|
Date
|
Class Topic
|
On-Line Lectures
|
White Boards
| |
Aug 20
|
Circuit Analysis,
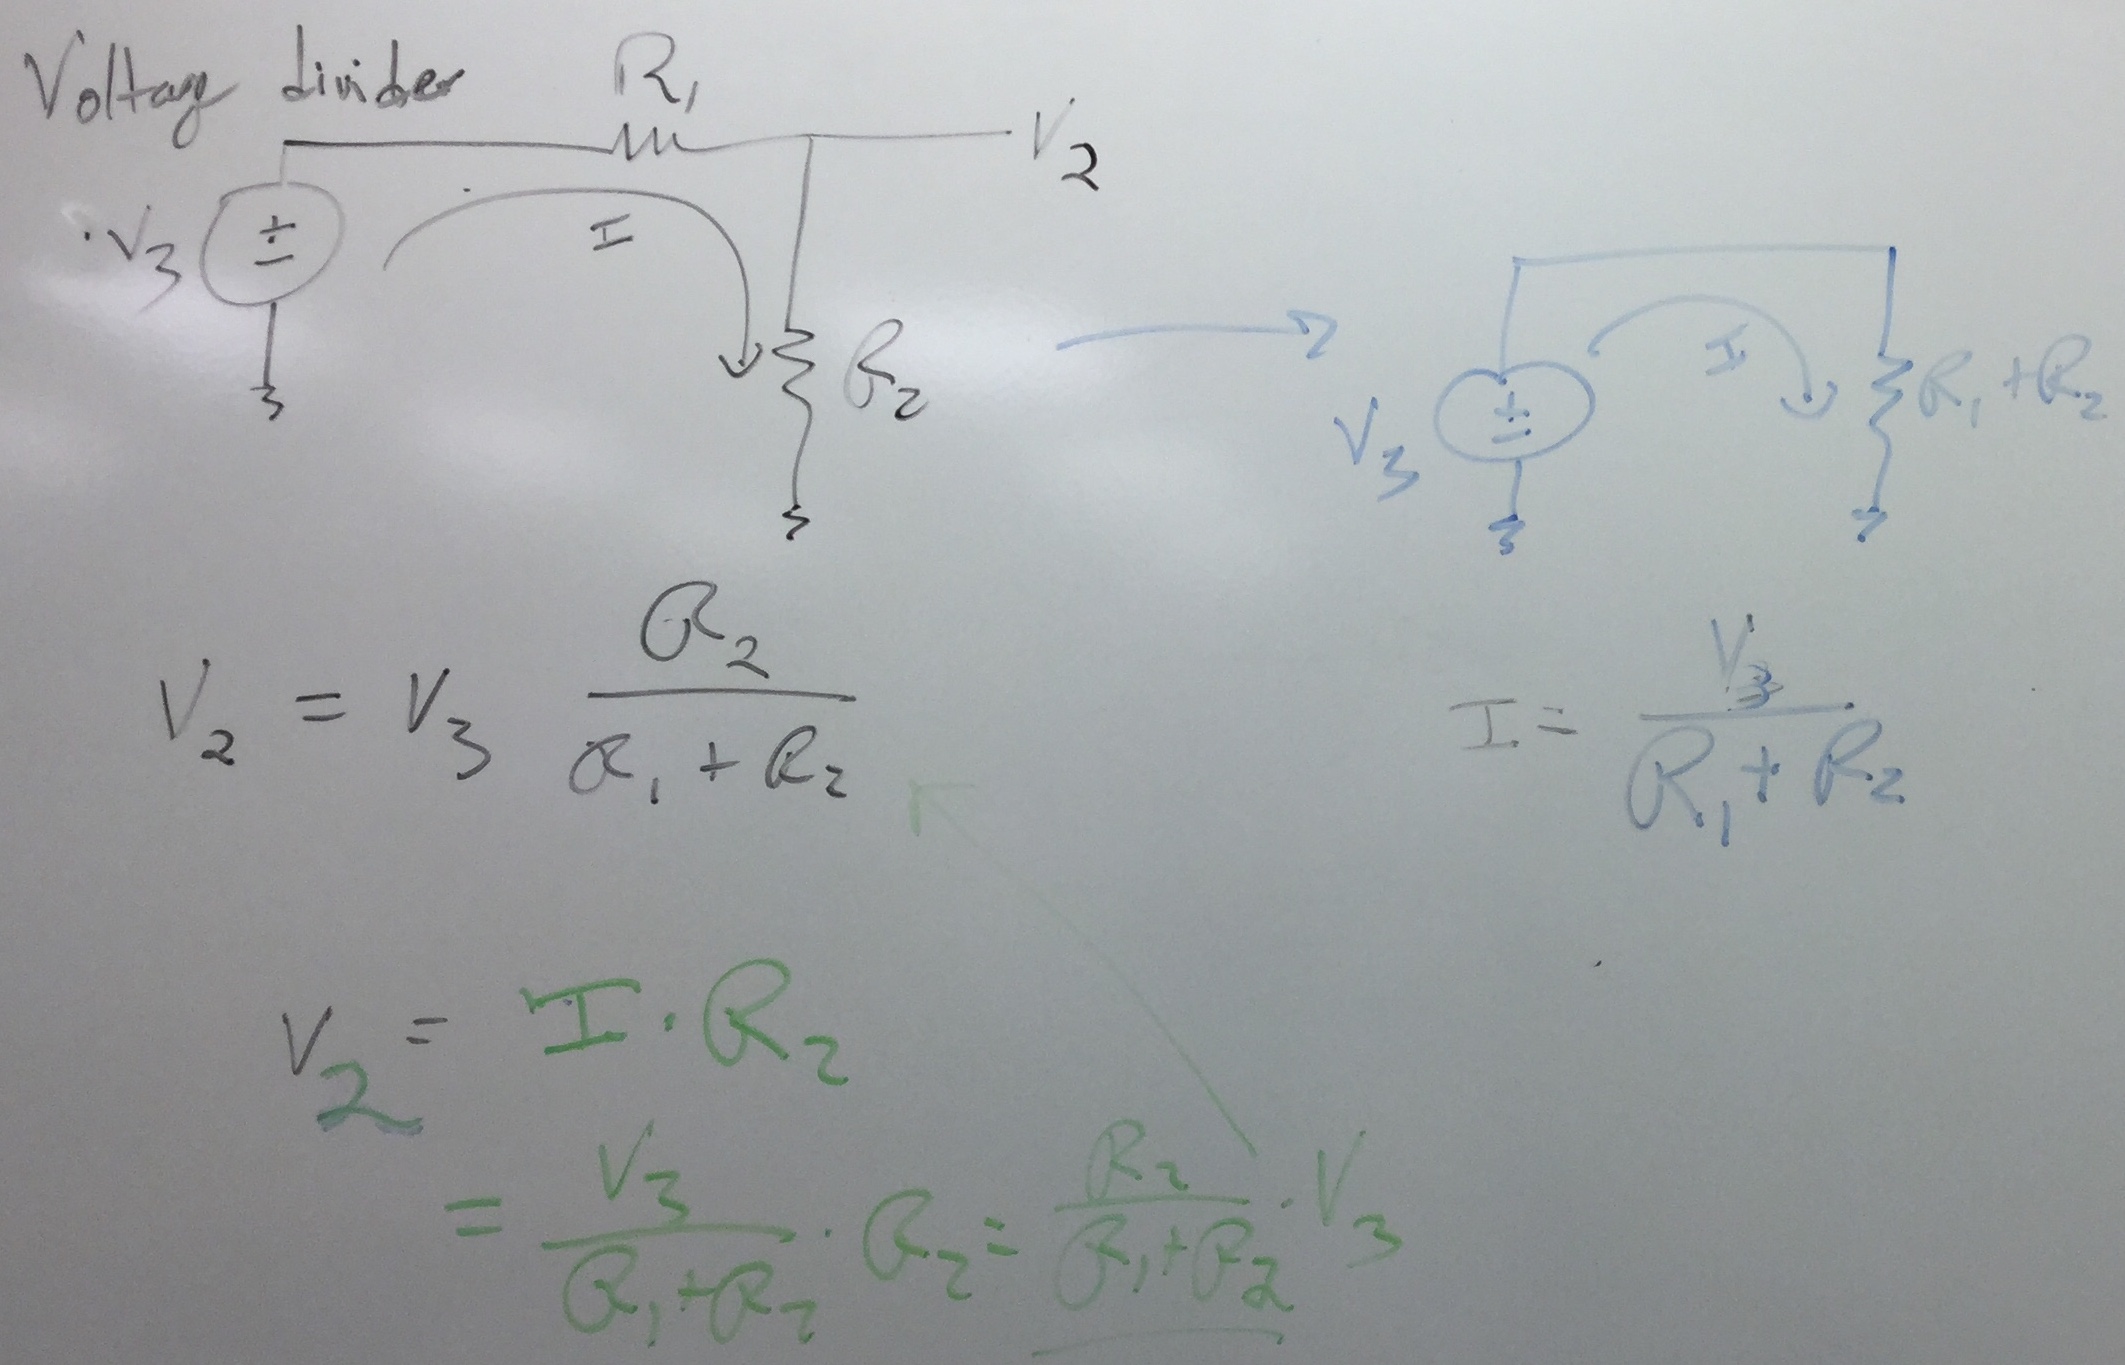
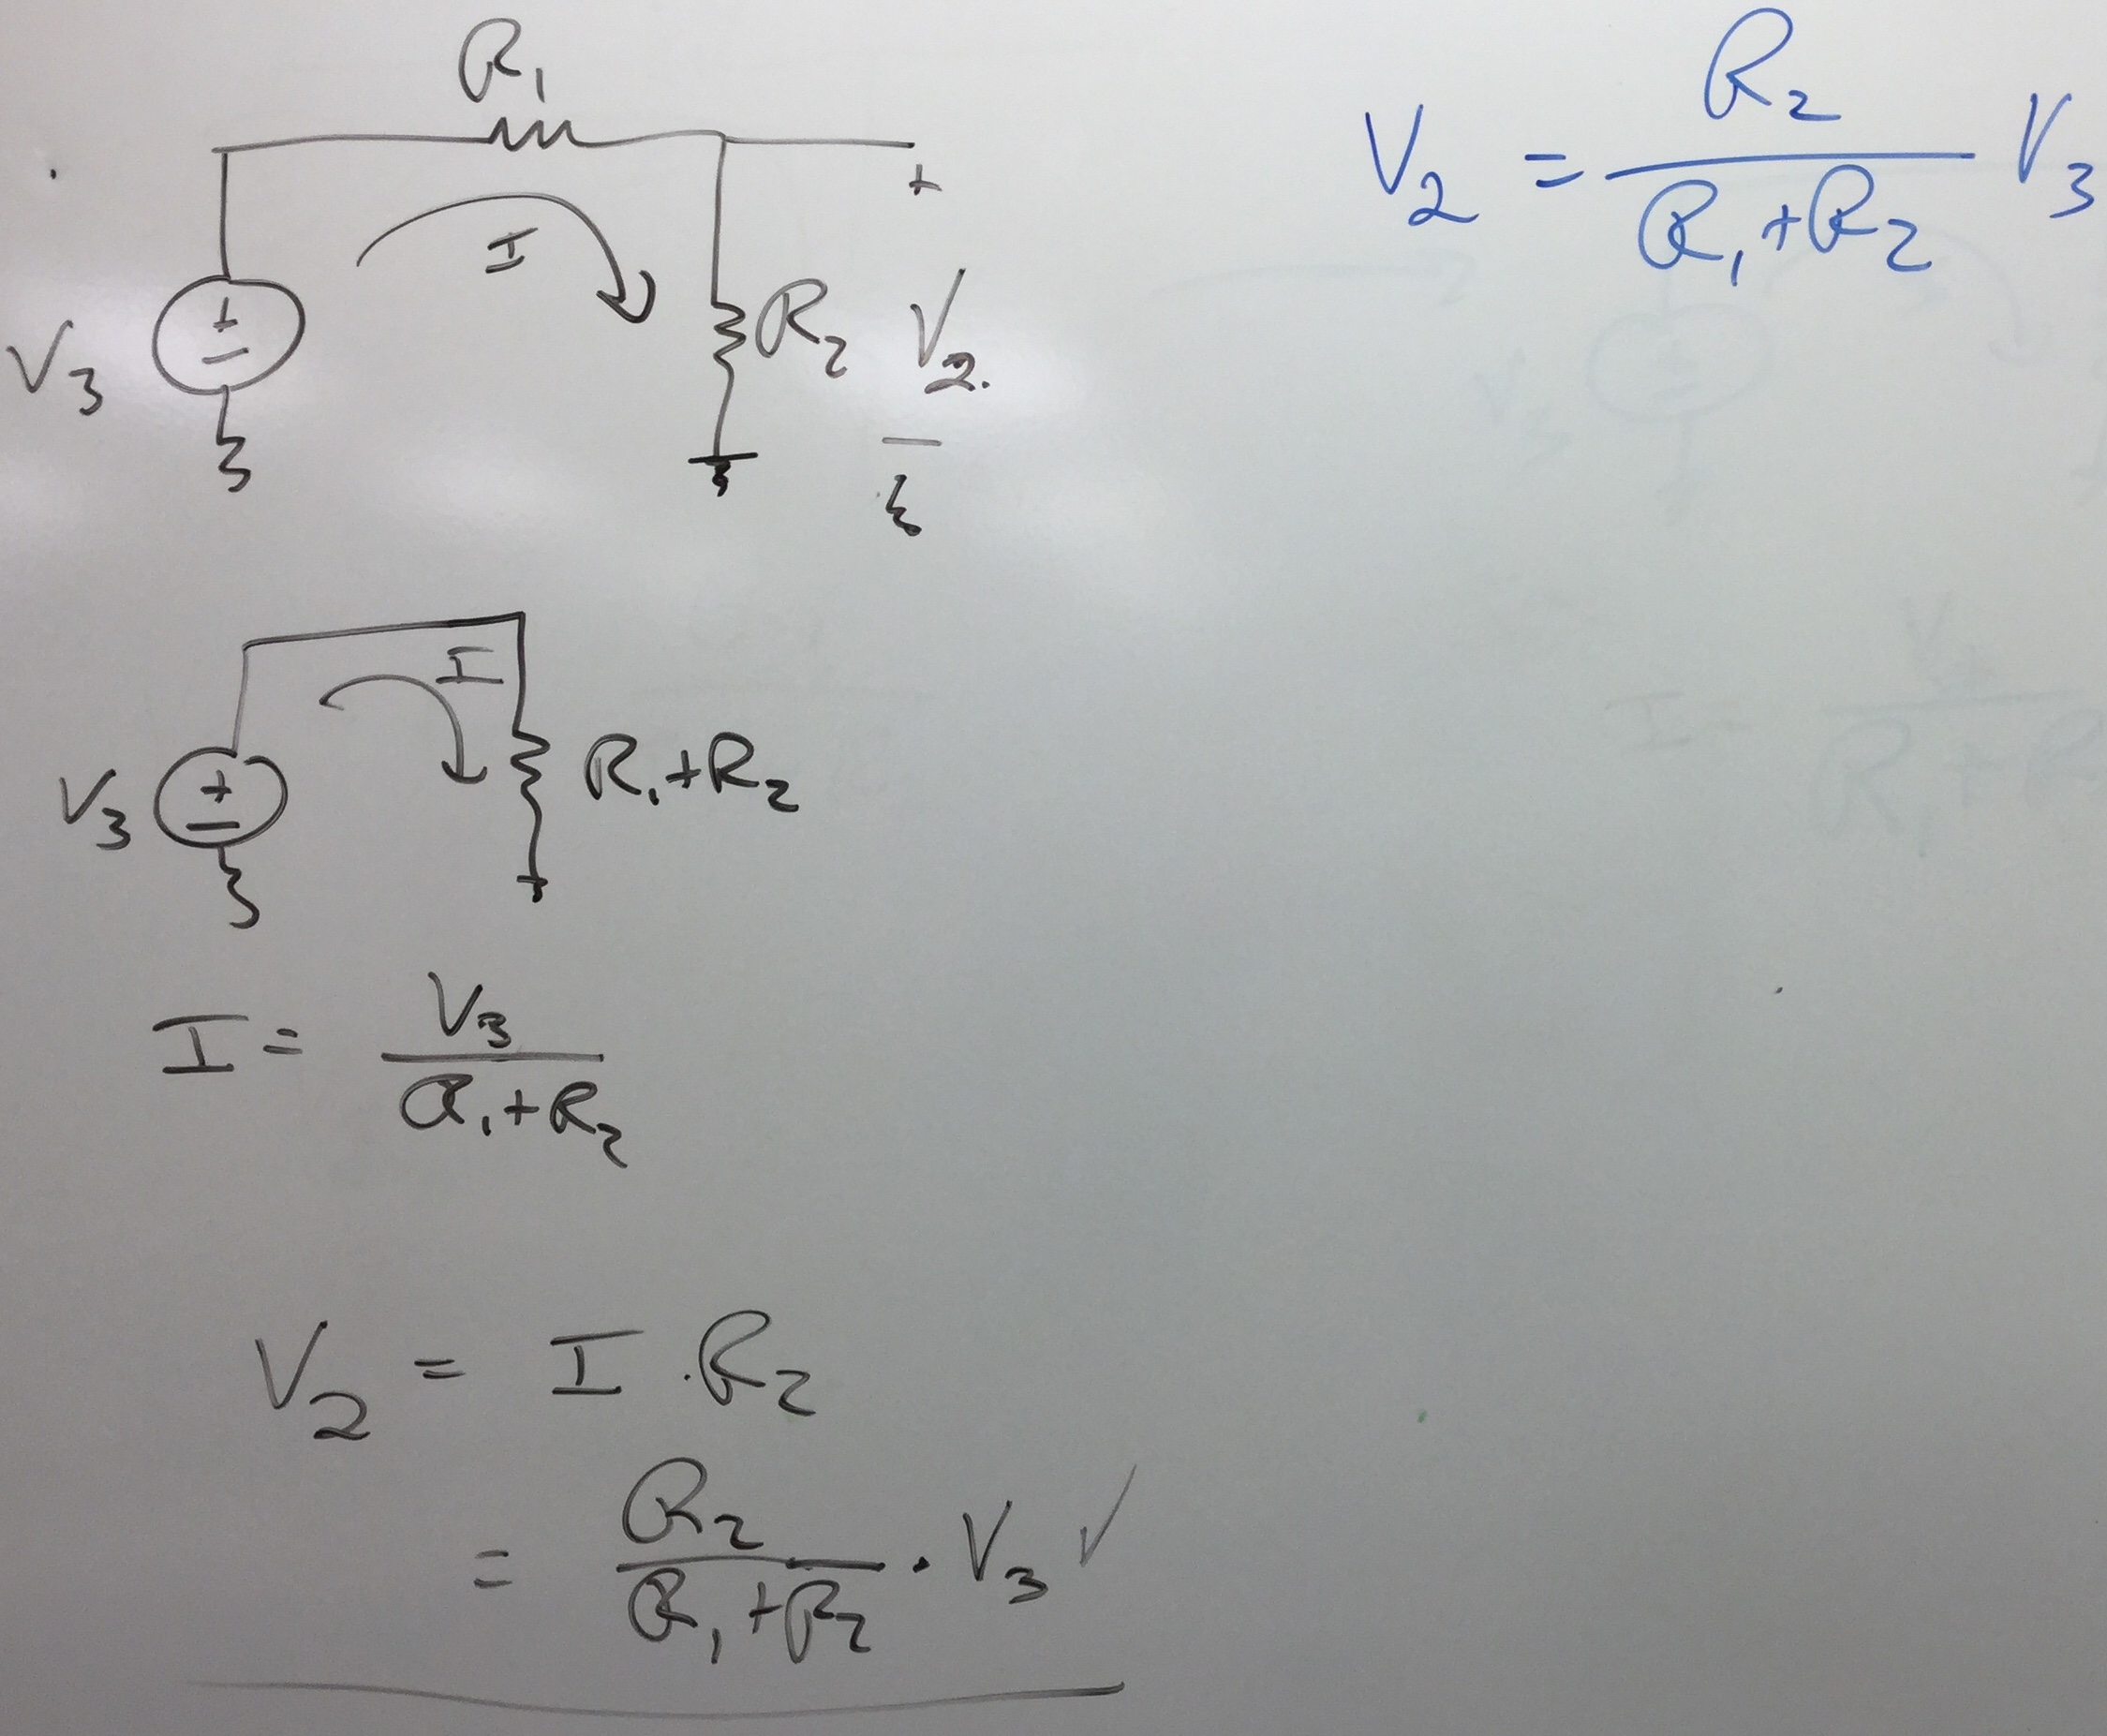
Voltage Dividers, and
Parallel--Series Circuits,
|
Linear Circuits,
Linear Circuit Analysis,
Series & Parallel,
Series & Parallel Reduction,
Dependent Current Source ,
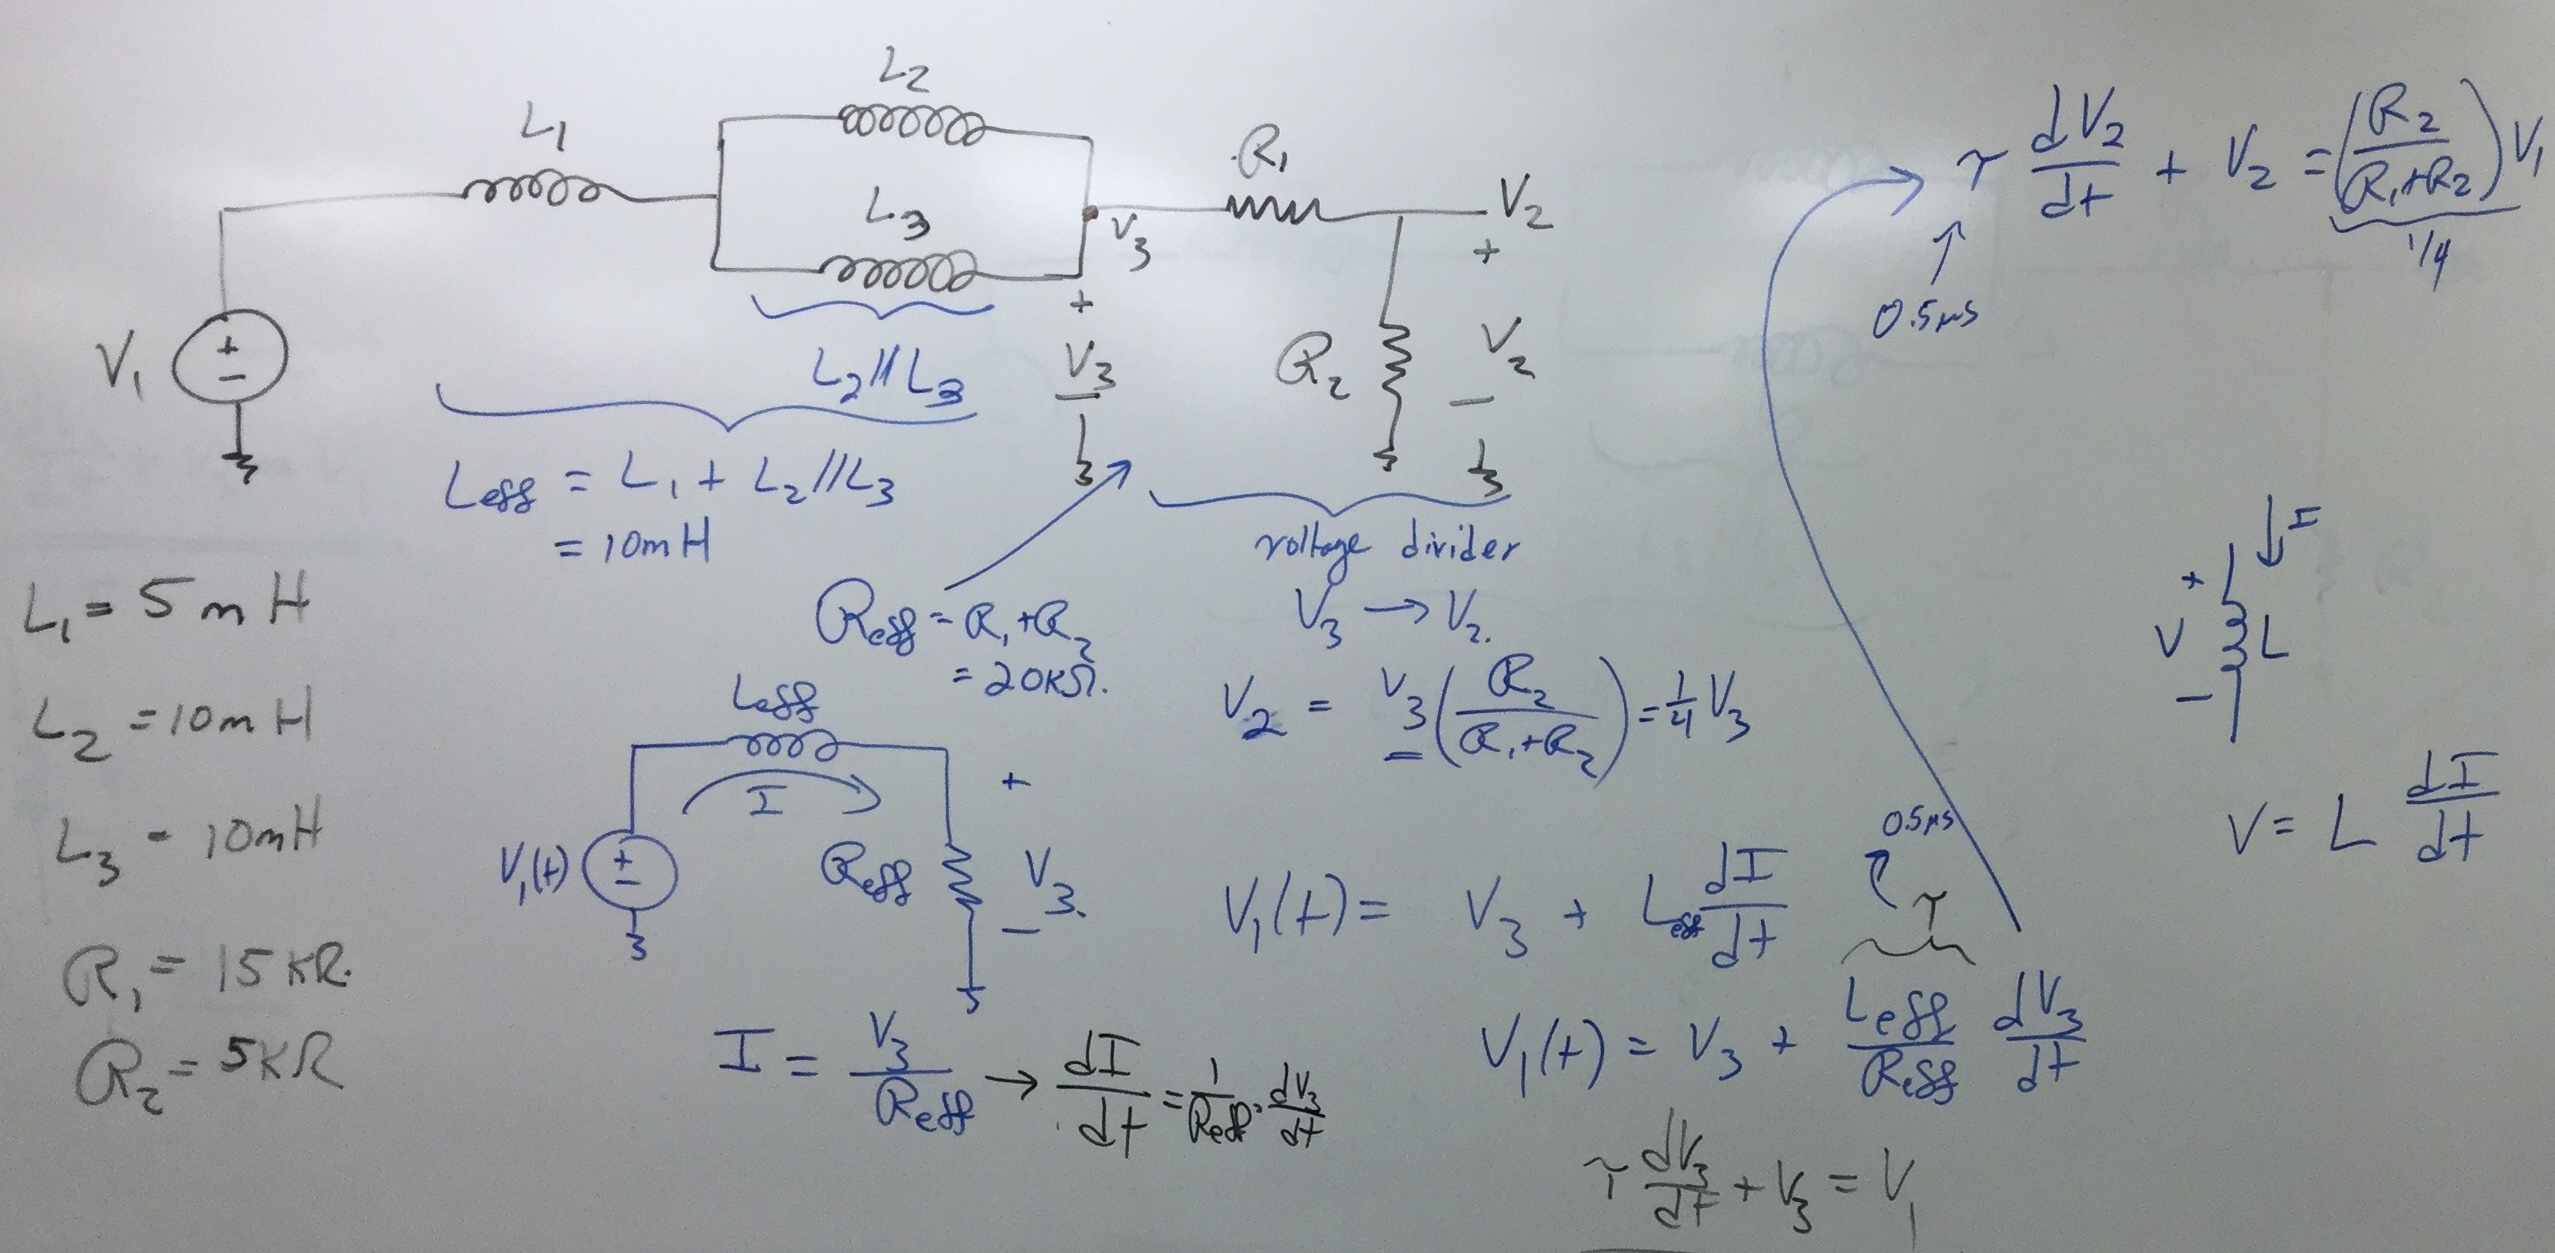
Parallel-Series R & L
|
1 ,
2 ,
3 ,
4 ,
5 ,
6 ,
| |
Aug 25
|
Thevenin--Norton
Equivalence
|
One-Port Resistive Circuits,
Thevenin-Norton Equivalents,
Resistive Current Divider,
Dependent Source Example,
Solution using Thevenin-Norton,
Transforming to a One-Port Model
|
1 ,
2 ,
3 ,
4 ,
5 ,
6 ,
7 ,
| |
Aug 27
|
Lab Day
|
Work on Lab
before class
Curve Fitting
|
Lab day
| |
Sept 1
|
Computer analysis
More circuit analysis
|
Computer Analysis:
Nodal Analysis
Mesh Analysis
Node + Dependent Source
Mesh + Dependent Source
State Holding Divider
|
1 ,
2 ,
3 ,
4 ,
5 ,
6 ,
7 ,
| |
Sept 3
|
Superposition,
Symmetric circuits,
|
Circuit Analysis:
Superposition
Symmetric Circuits
Symmetric Circuit 02
Symmetric Circuit 03
R-2R Ladder R Analysis
R-2R Ladder V Analysis
|
1 ,
2 ,
3 ,
4 ,
5 ,
6 ,
7 ,
8 ,
| |
Sept 8
|
Unit Review
|
Dependent Source
example
Dependent-Source Example
Dependent Sources Example
Superposition
Resistor Example,
Superposition
Capacitor
Example,
Symmetric Current Circuit
Thevenin-Norton
One-Port
Example 1,
Thevenin-Norton
One-Port
Example 2
|
|
Unit 1 finishes with the exam on September 10.
Most of the slides in
.pdf
version from the taped lectures above
Outside Videos of Interest
-
A short video solving
series and parallel
resistor problems
-
Building and measuring a discrete
current implementation
- Ali Hajimiri (Calech) lectures on circuits.
Somewhat different perspective from my material,
but excellent material with recognizable topics:
link
-
Youtube lecture on DC Circuit Analysis:
Video ,
Slides
- For those with an interest in quantum physics,
the same process we discuss as superposition for linear circuits
is the same concept of superposition in quantum mechanics
as the description of quantum mechanics is a linear system.
You might see the similarities in this short
introduction .
Reading
A few class items will be useful for this unit:
- Example Resistive Circuit
#1
- Exam 1, Spring 2019 with tentitive answers
pdf .
There can always be an answer that is not correct, so double check.
- Exam 2, Spring 2019 with tentitive answers
pdf .
There can always be an answer that is not correct, so double check.
- Exam 1, Spring 2020 with highlighted answers
pdf .
There can always be an answer that is not correct, so double check.
For the first unit, there are a few parts of the textbook
that might be helpful to read for the discussions:
- Read through Chapter 1 for an overview of basic electric circuit variables, and
read through Chapter 2 as a discussion of basic circuit elements.
A detailed read is not critical, but the on-line videos are absolutely essential.
- Chapter 3 gets into the analysis of resistive circuits.
You should read
Chp. 3.3 and
Chp. 3.4: Voltage and Current divider.
- Chapter 4 is primarily how to use computers to do resistive (and later general linear) analysis
using computers.
We will primarily look at Chp. 4.2 - 4.6.
Some examples would include using MATLAB (using the linear algebra solvers)
or SPICE (using its internal solver).
The approach is to find a general way to transform a resistive network into a linear algebra solution.
These techniques are called Mesh and Nodal Analysis.
The concepts and approaches are useful, and good for understanding circuit analysis.
We rarely will be solving significant linear systems by hand in this straight-forward manner,
but it provides a way for you to create a computer solution to a particular circuit problem.
- Chapter 5: We learn a number of key circuit techniques.
Superposition (5.3), and Thevenin--Norton Transformations and Analysis (5.4, 5.5).
We will understand one-port resistive network models,
and touch on two-port network models.
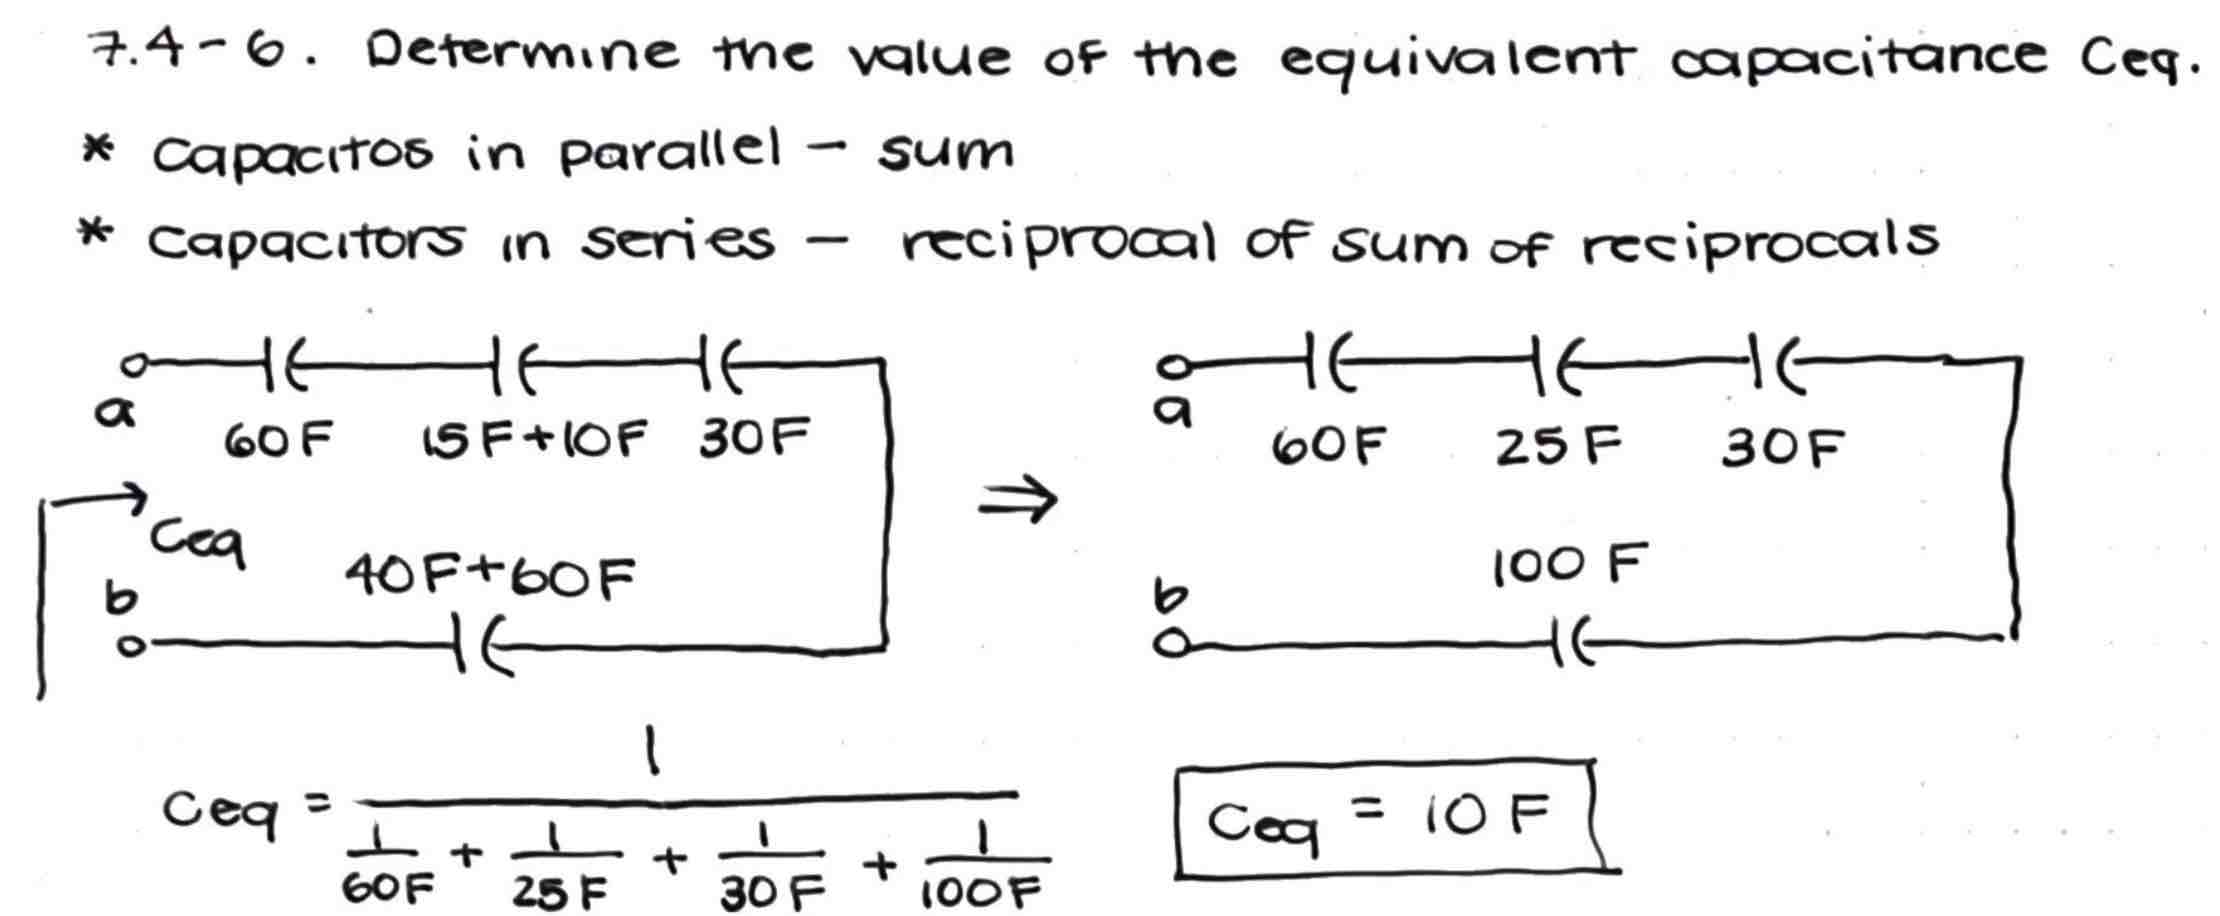
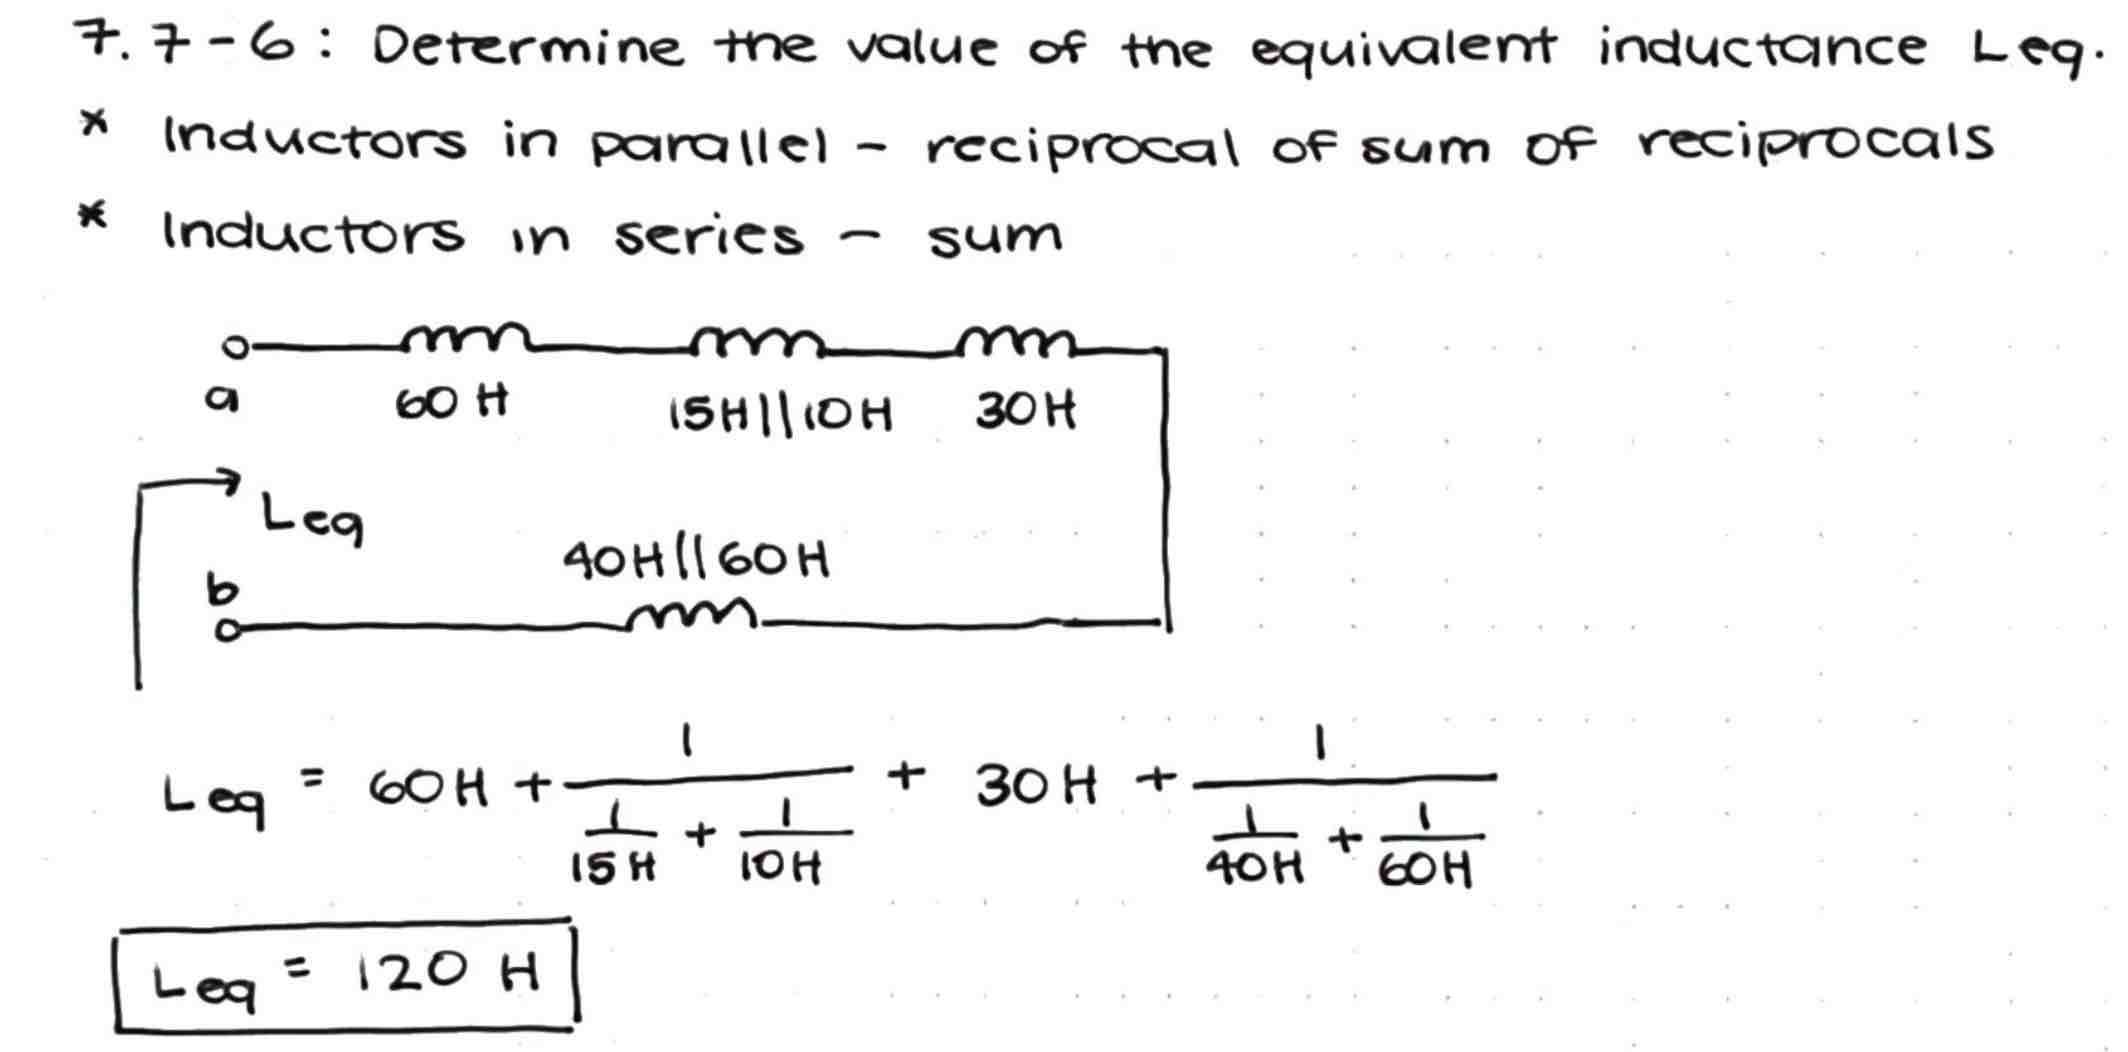
- Chapter 7 (7.4, 7.7) discusses parallel and series combination of capacitors and inductors
Assigned Homework Problems
Problems to be Submitted
- Set 1,
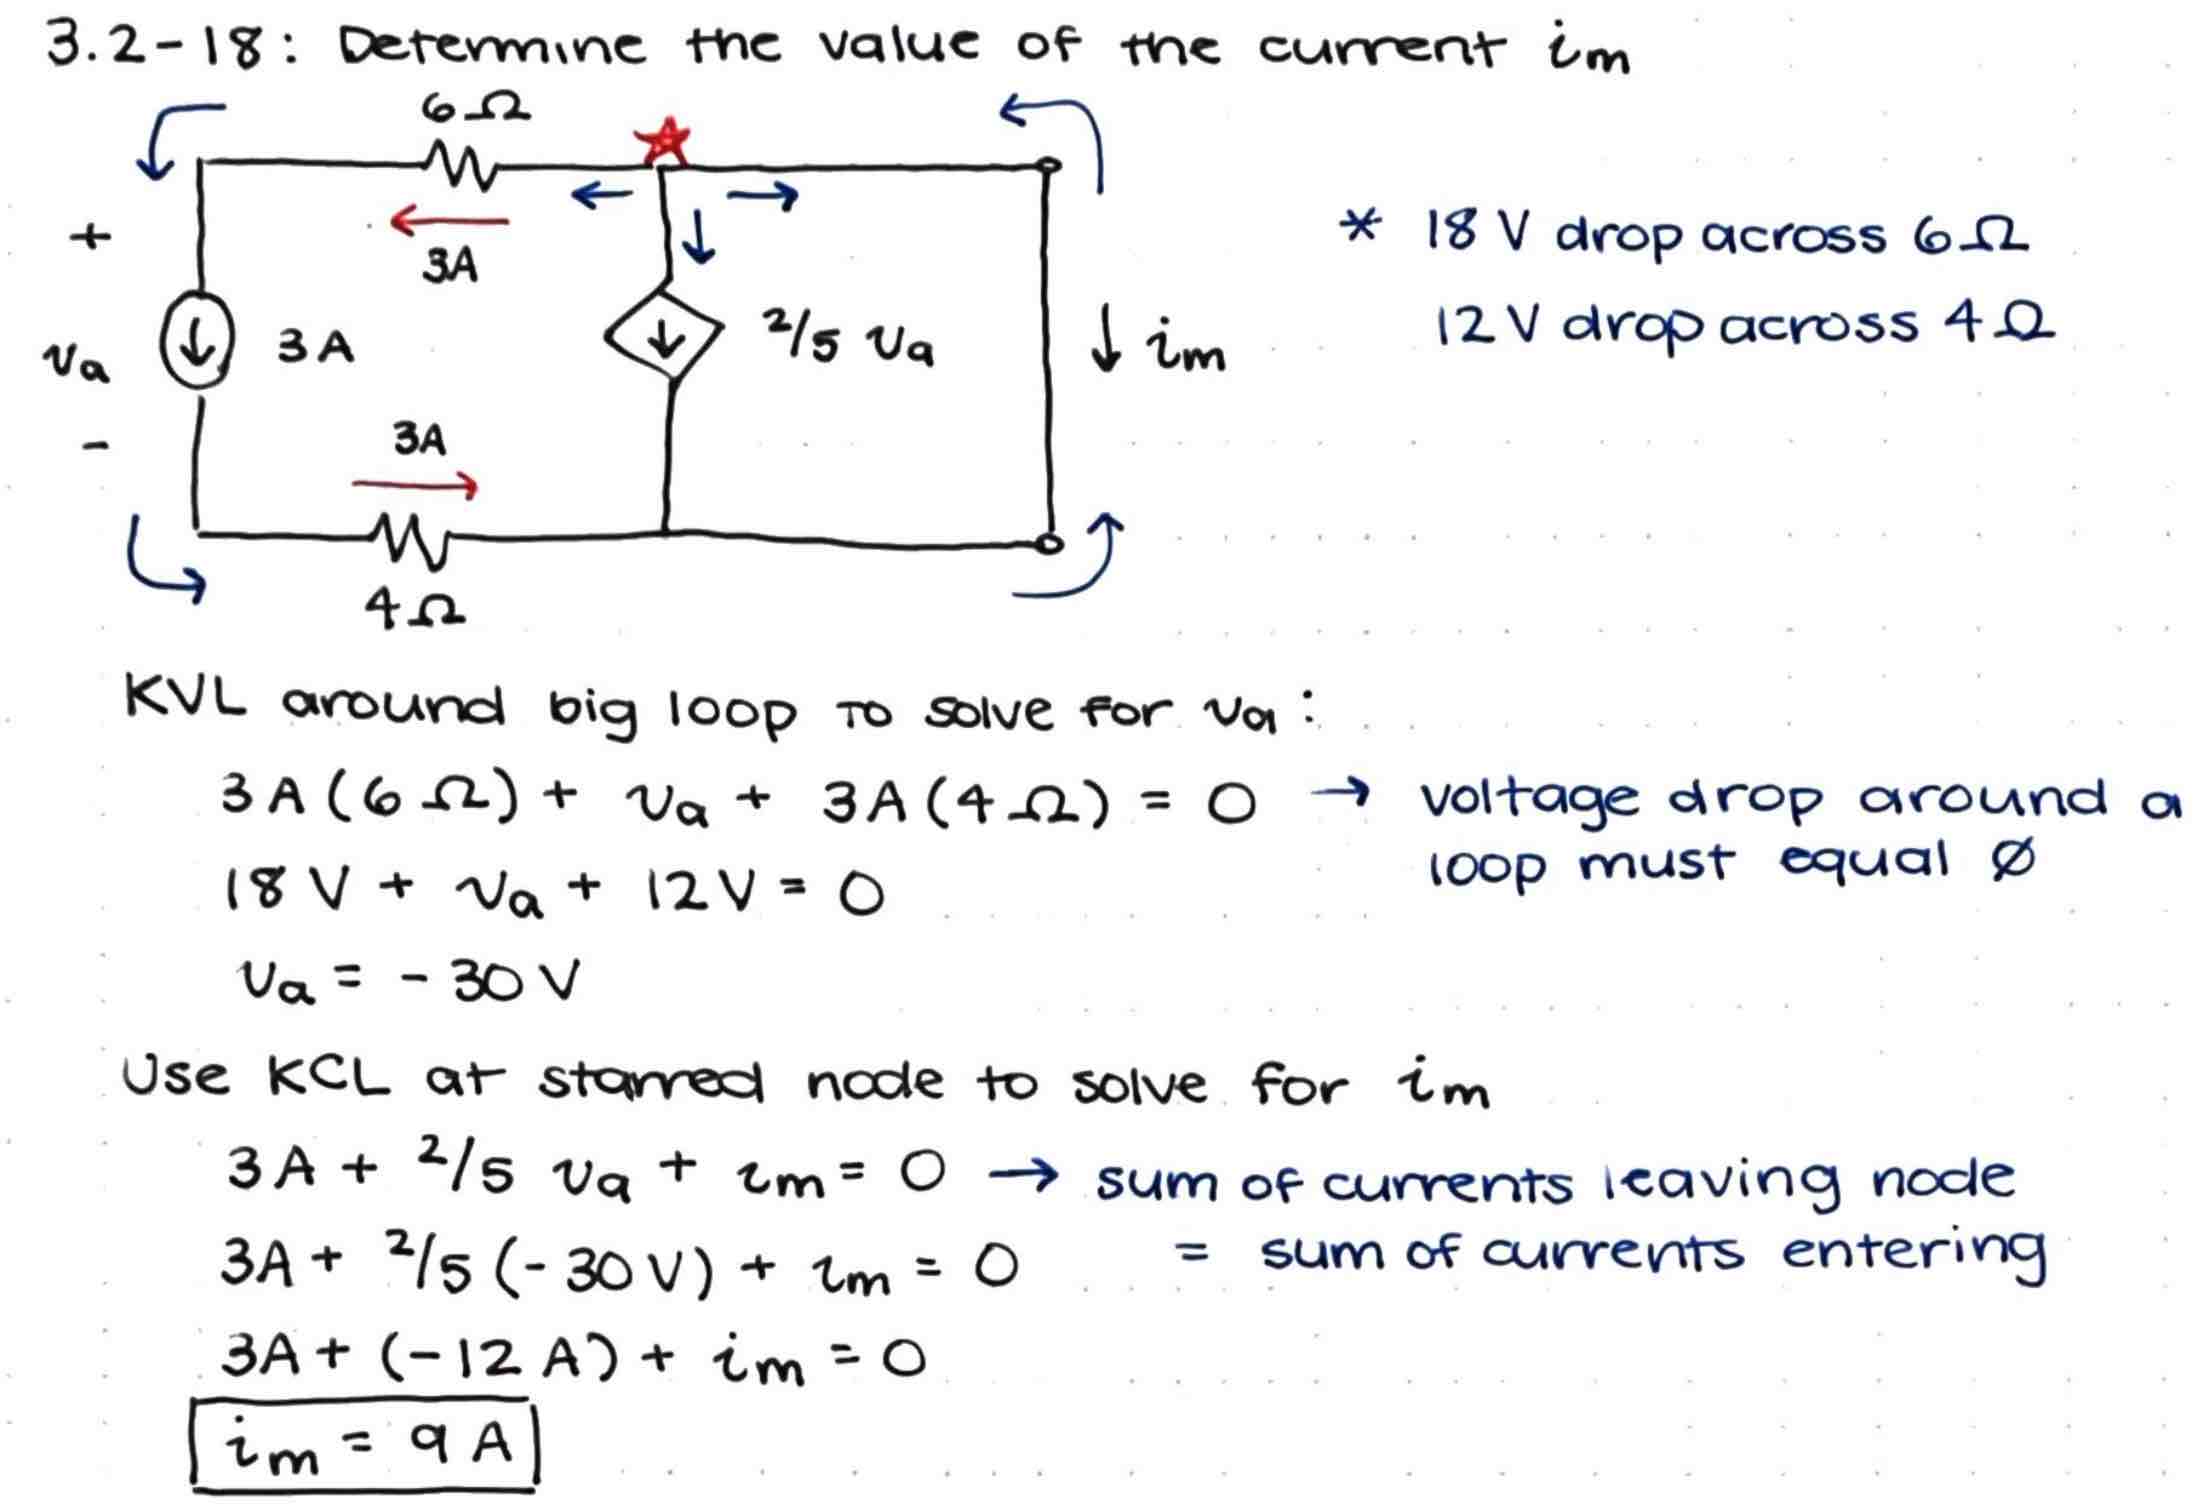
3.2-18,
Solution,
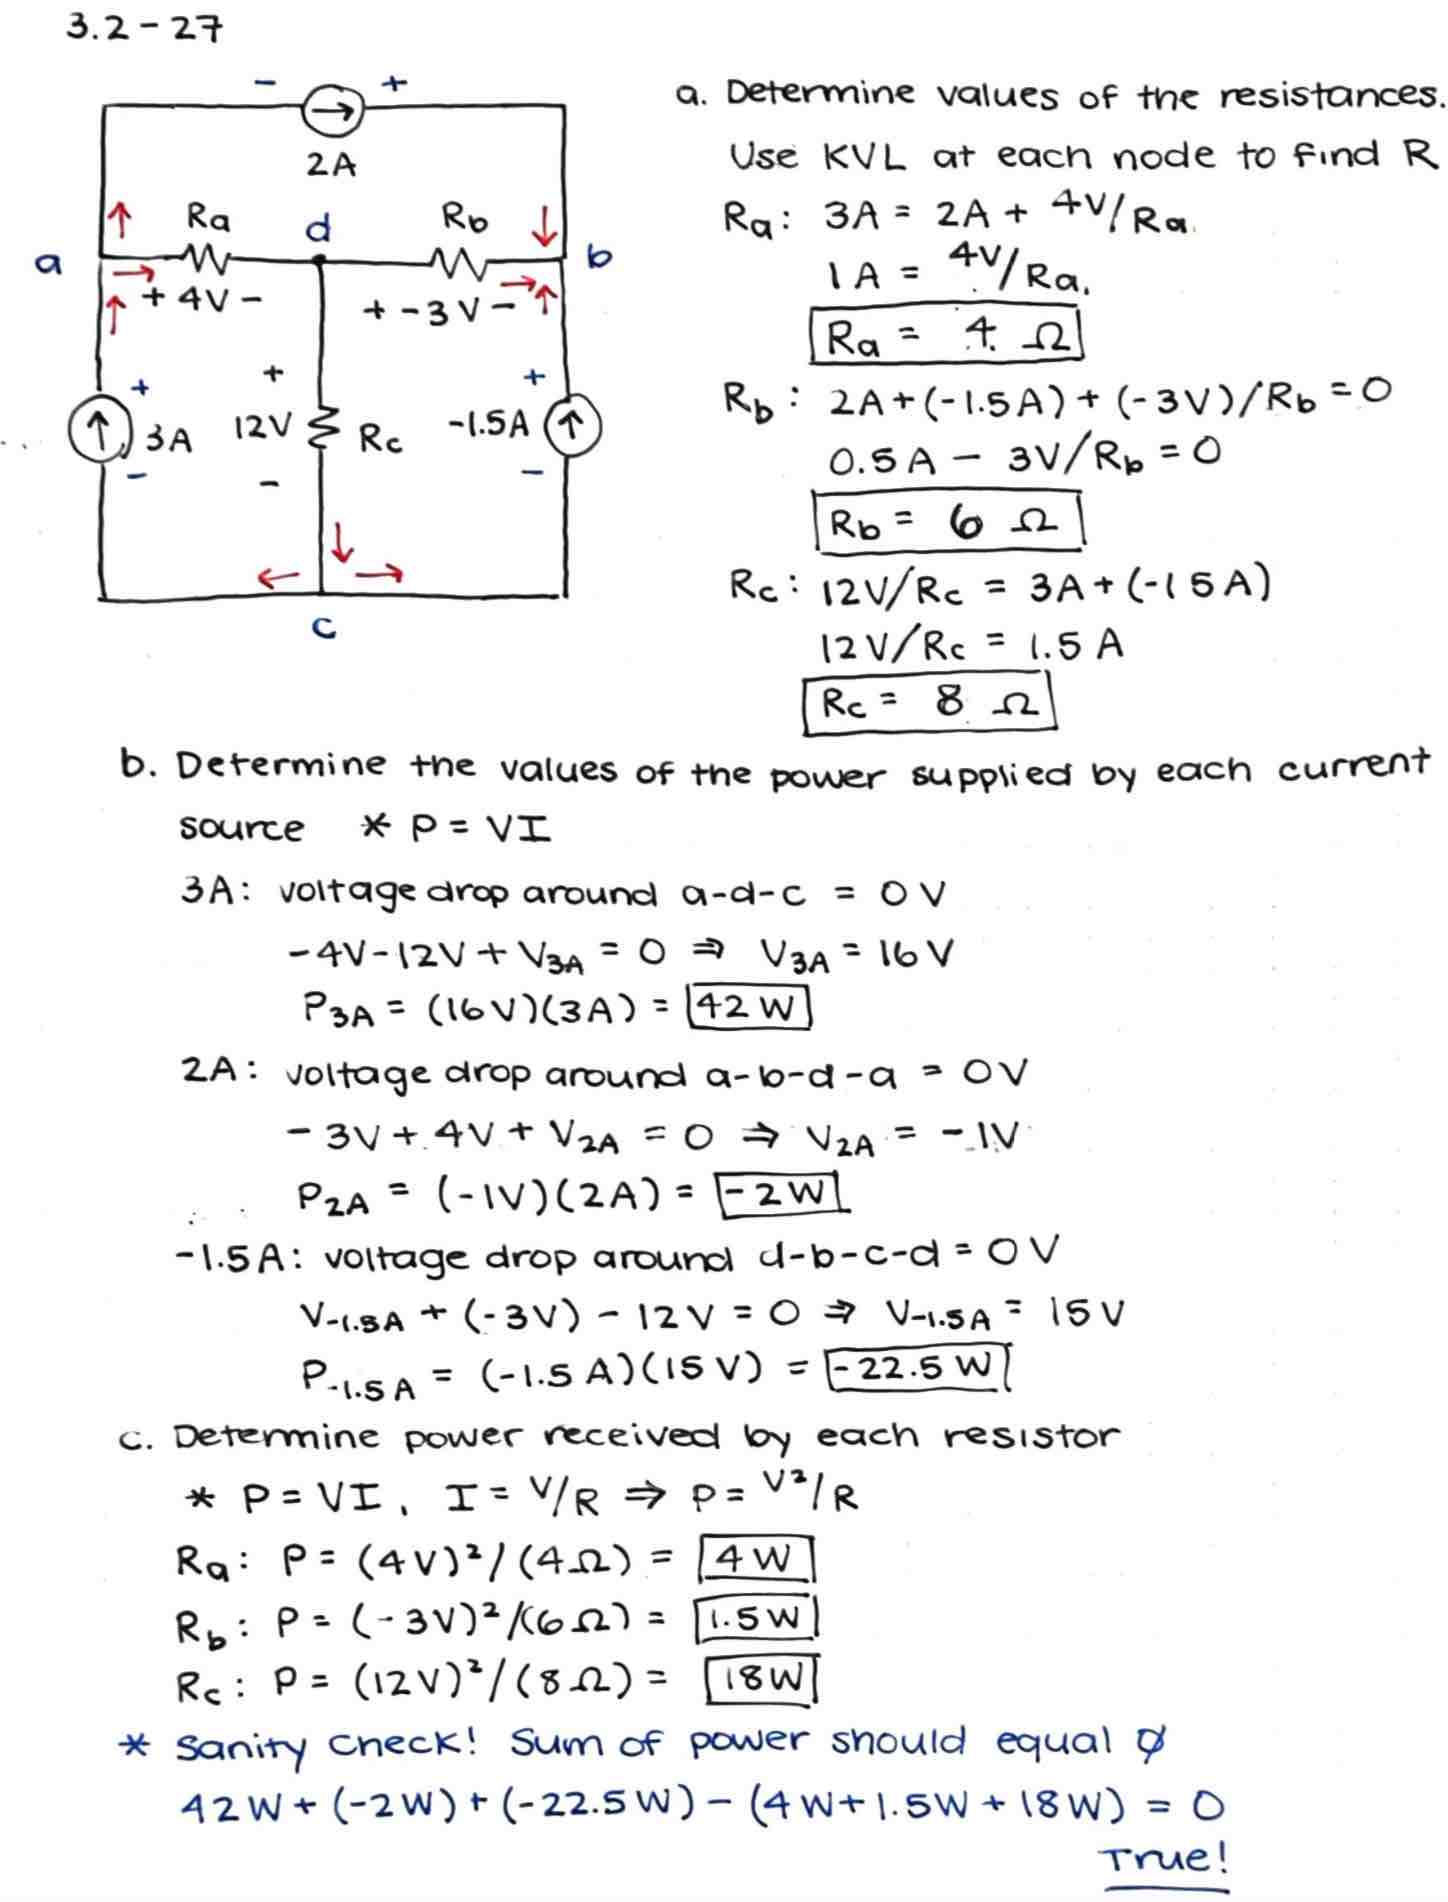
3.2-27,
Solution,
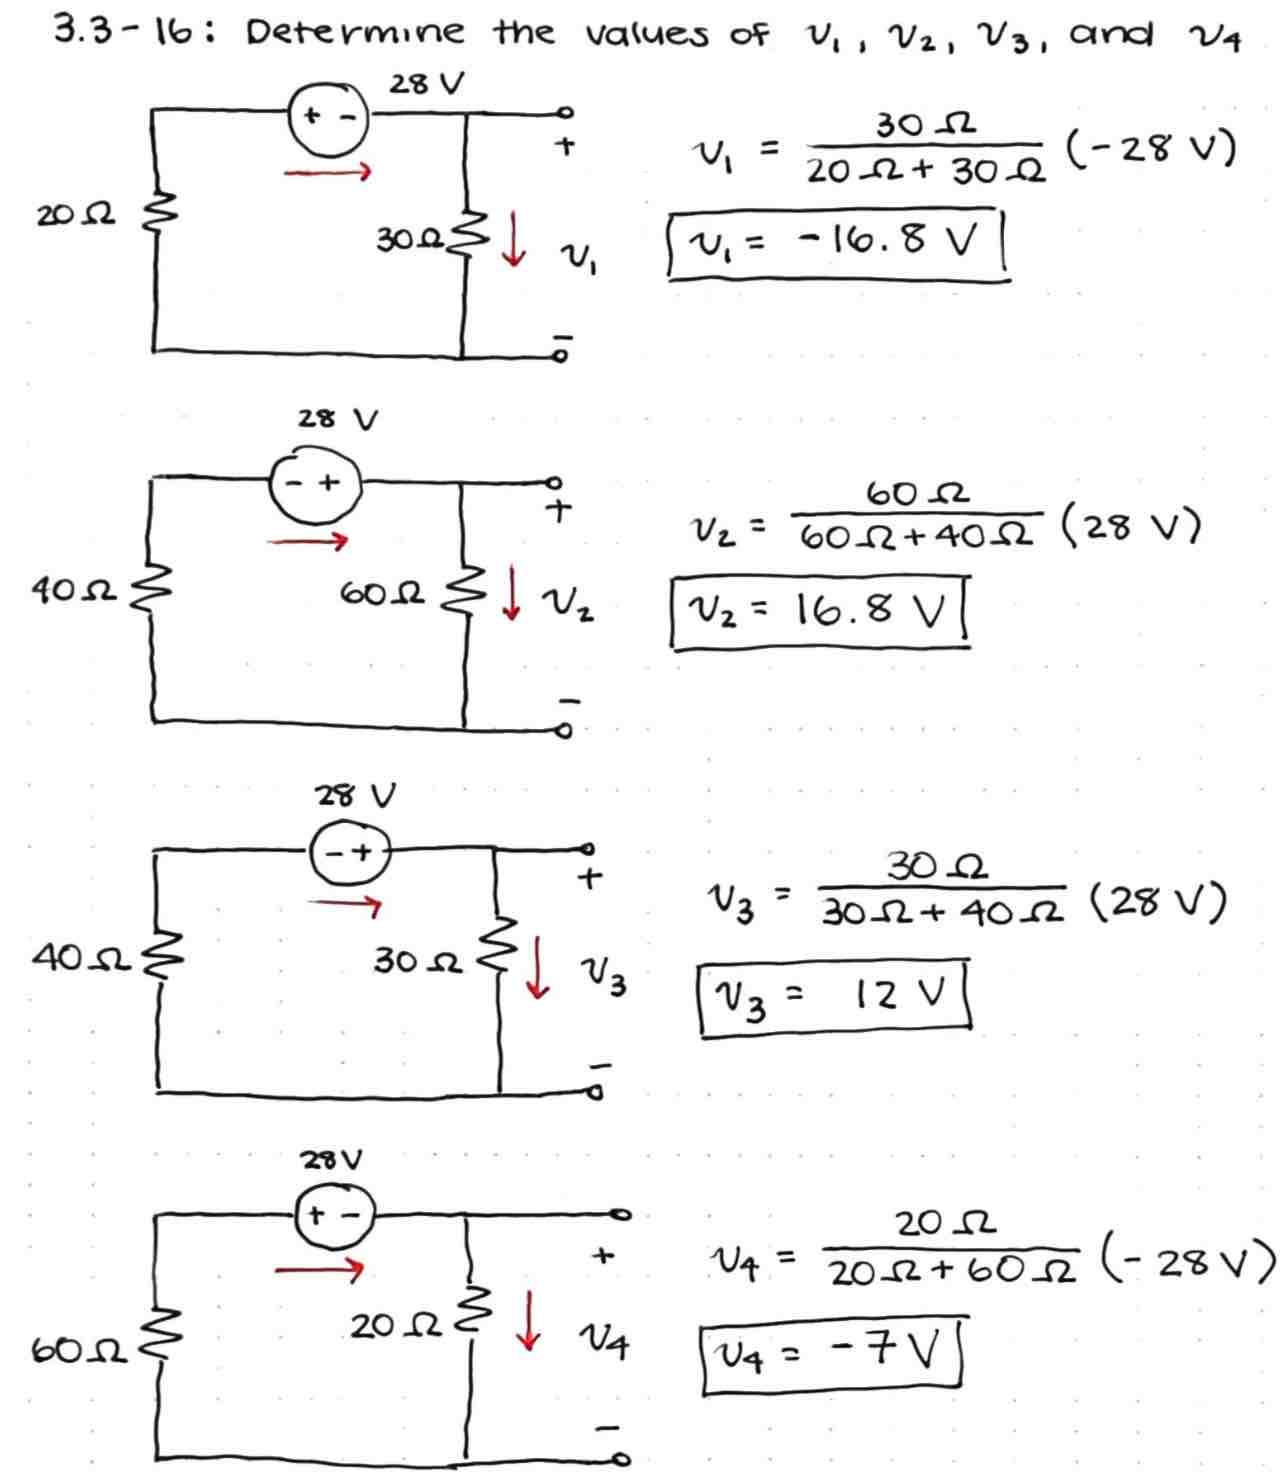
3.3-16,
Solution,
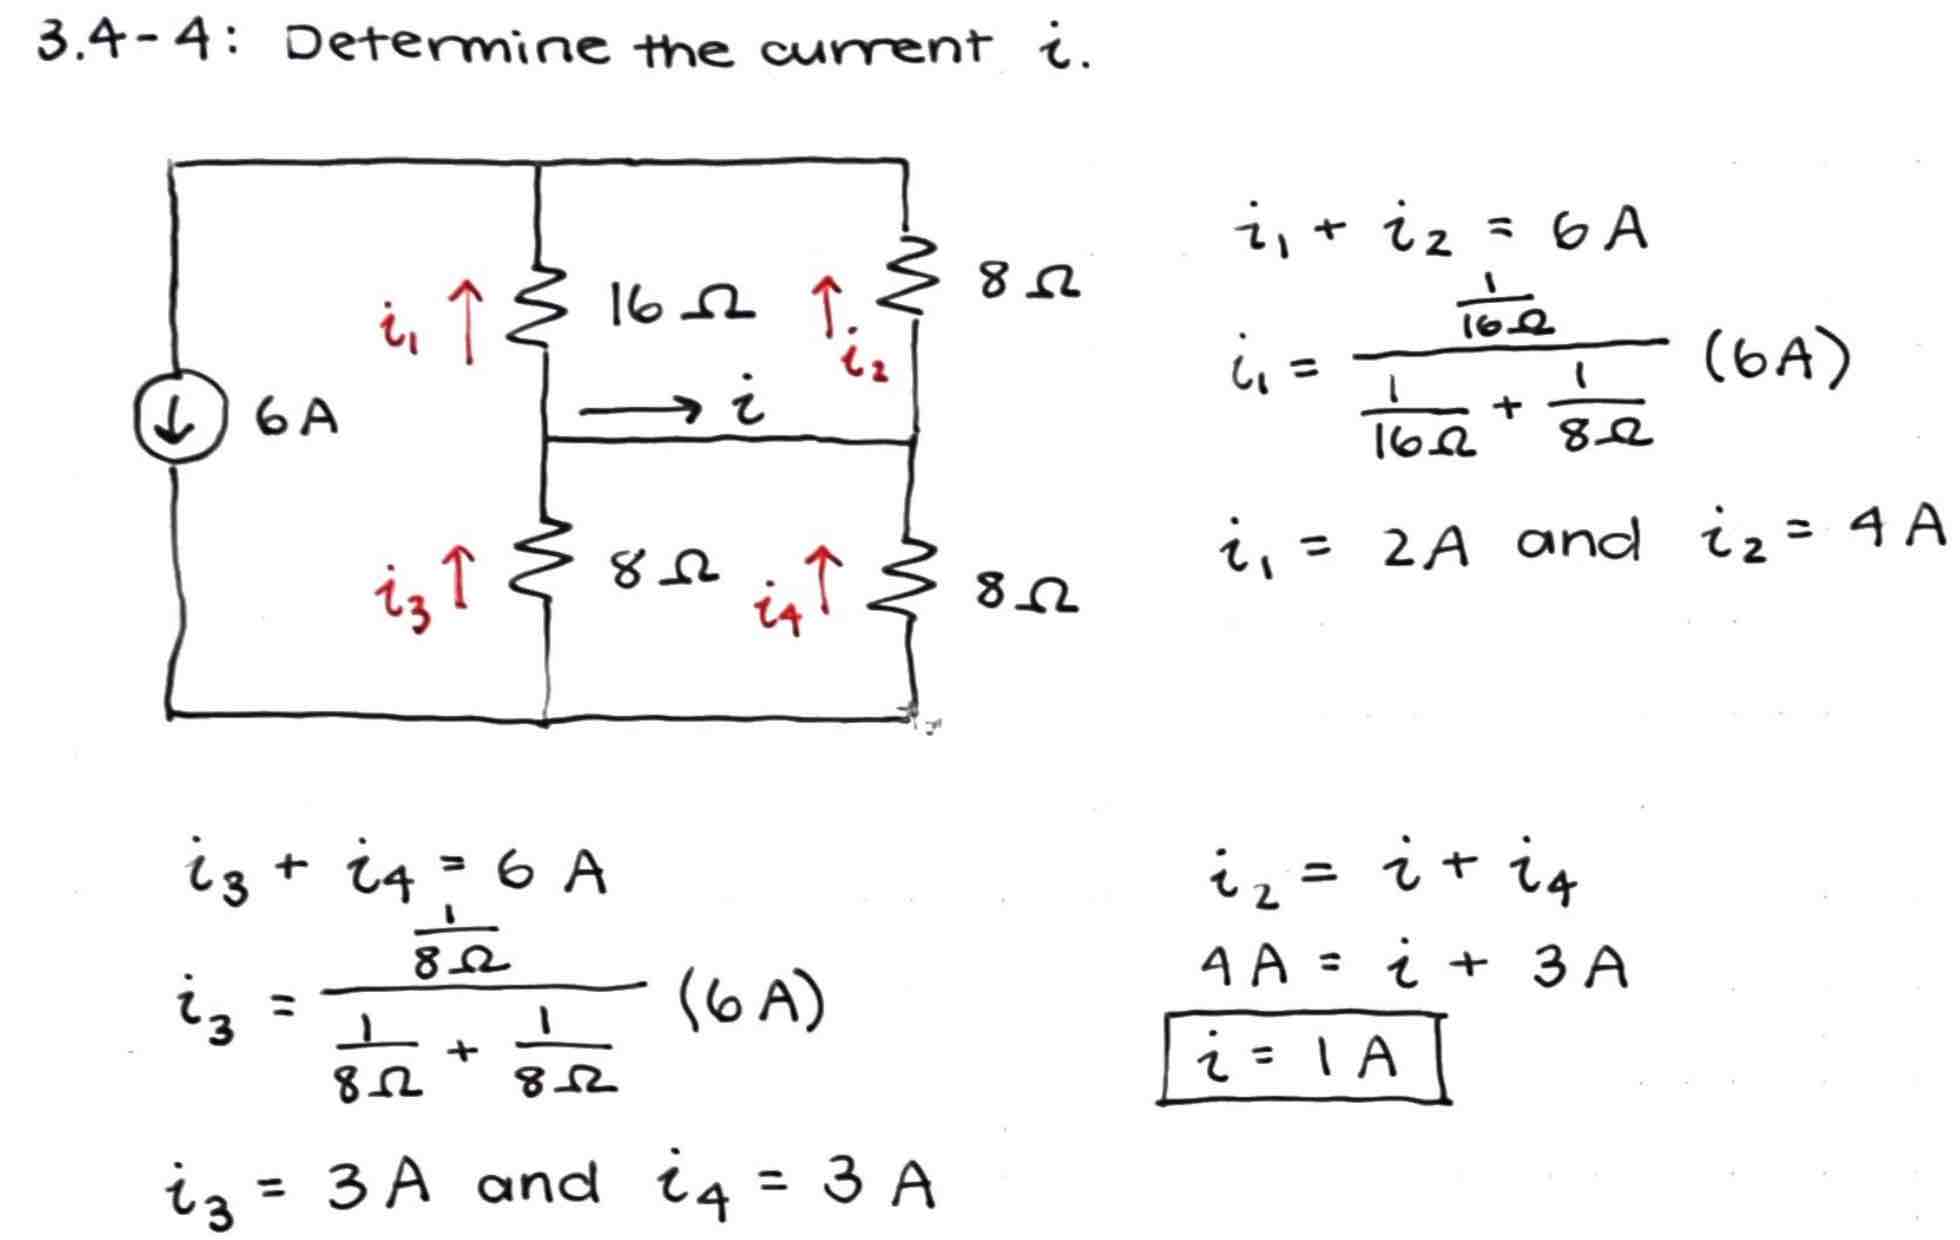
3.4-4,
Solution,
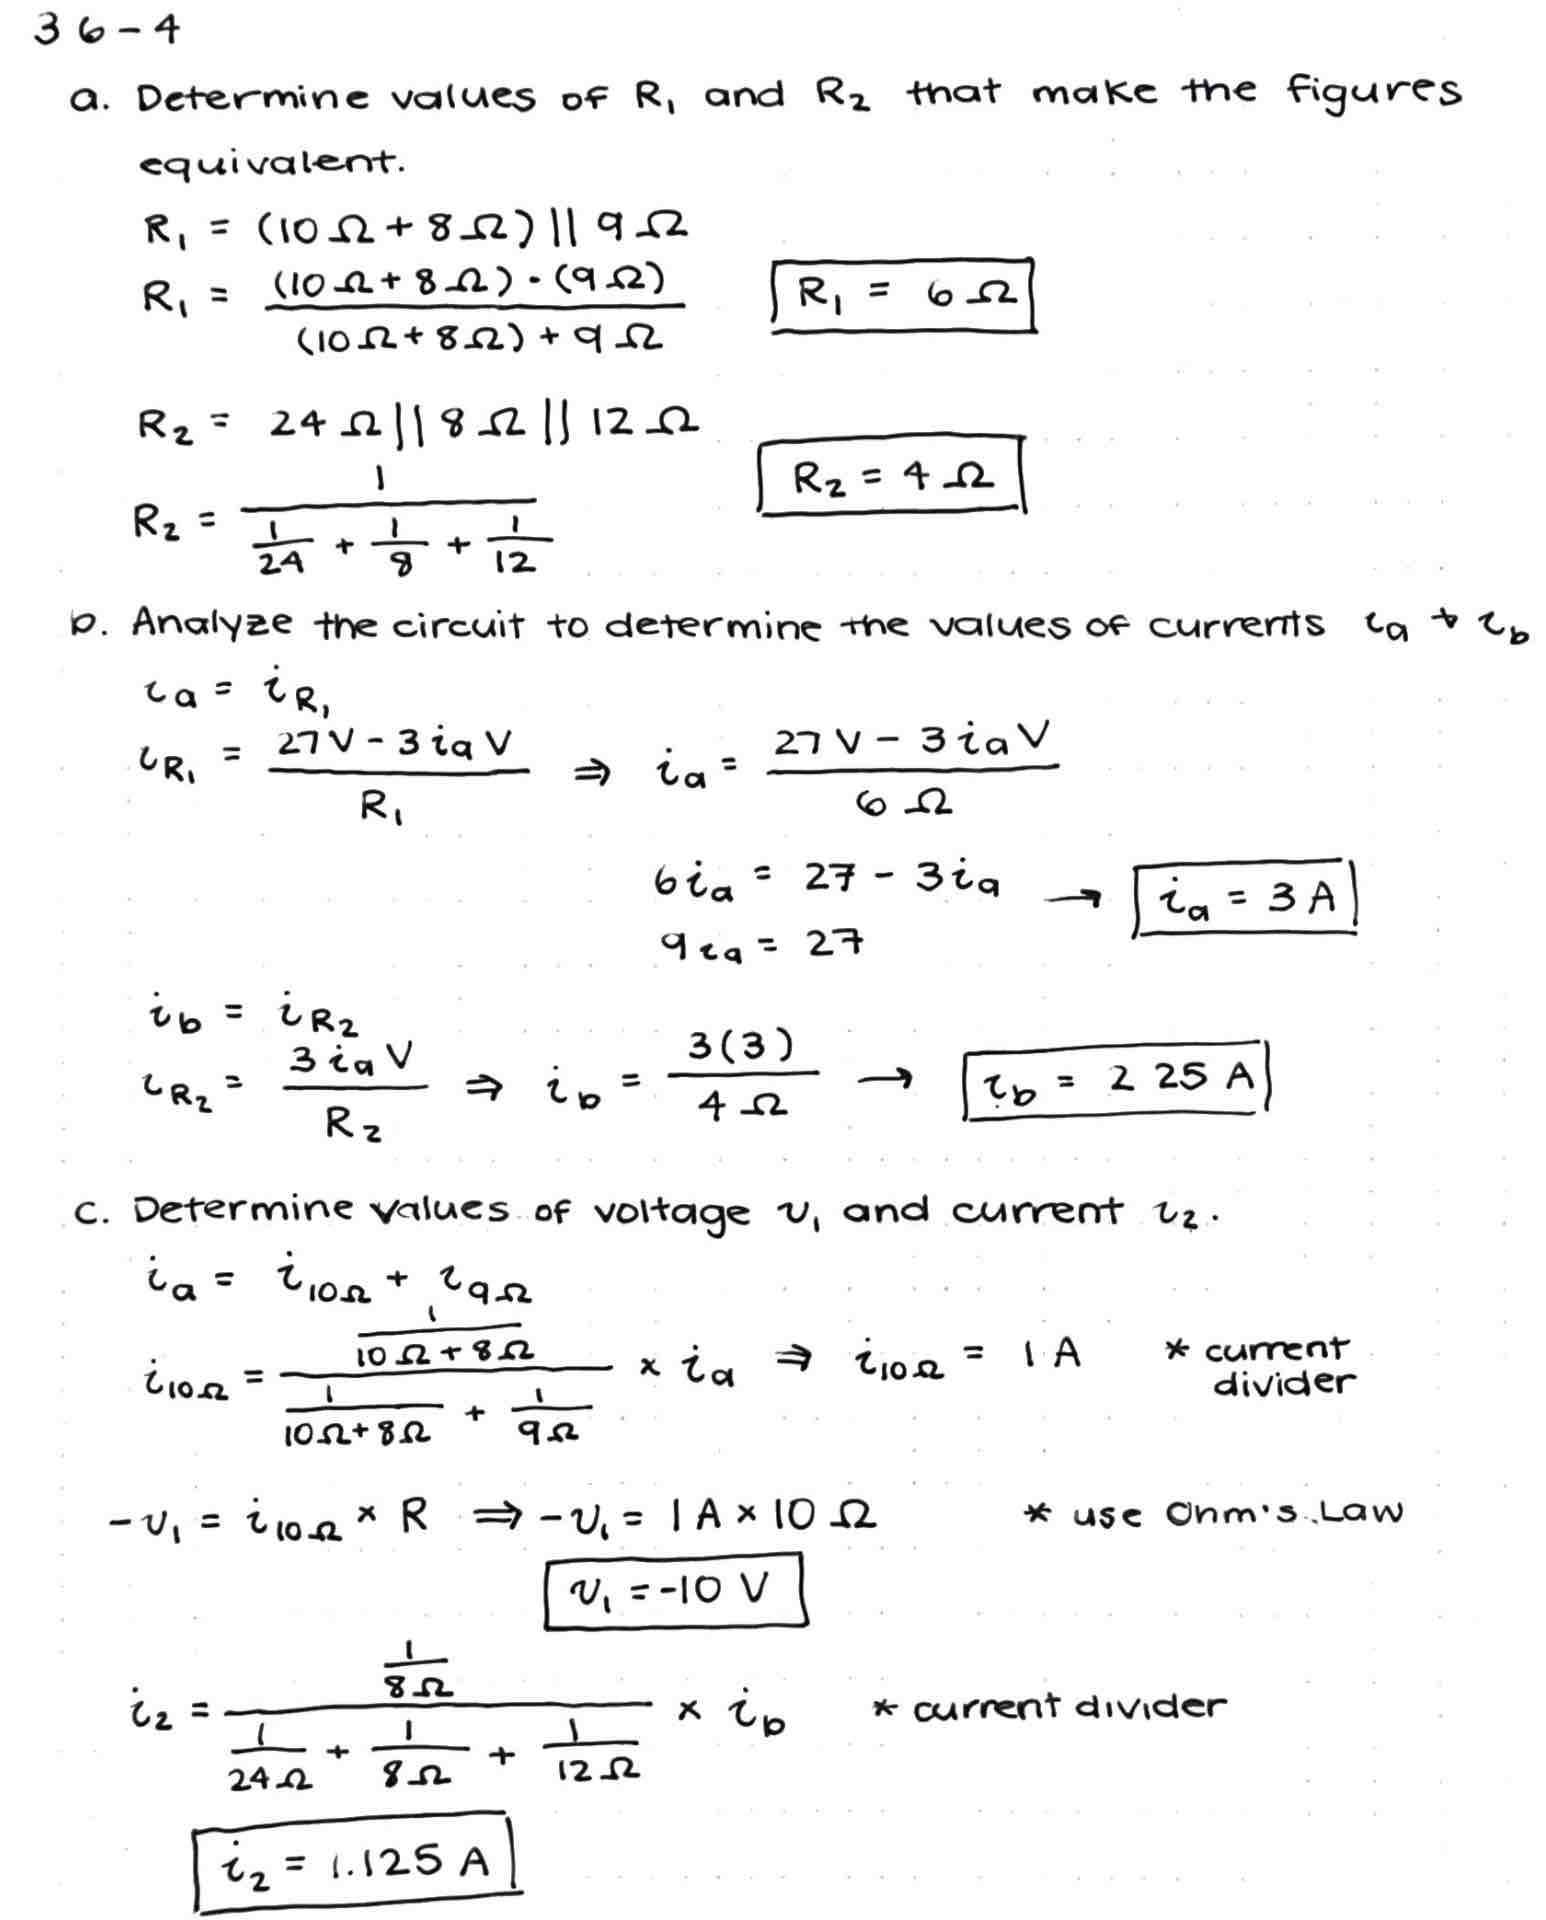
3.6-4 ,
Solution,
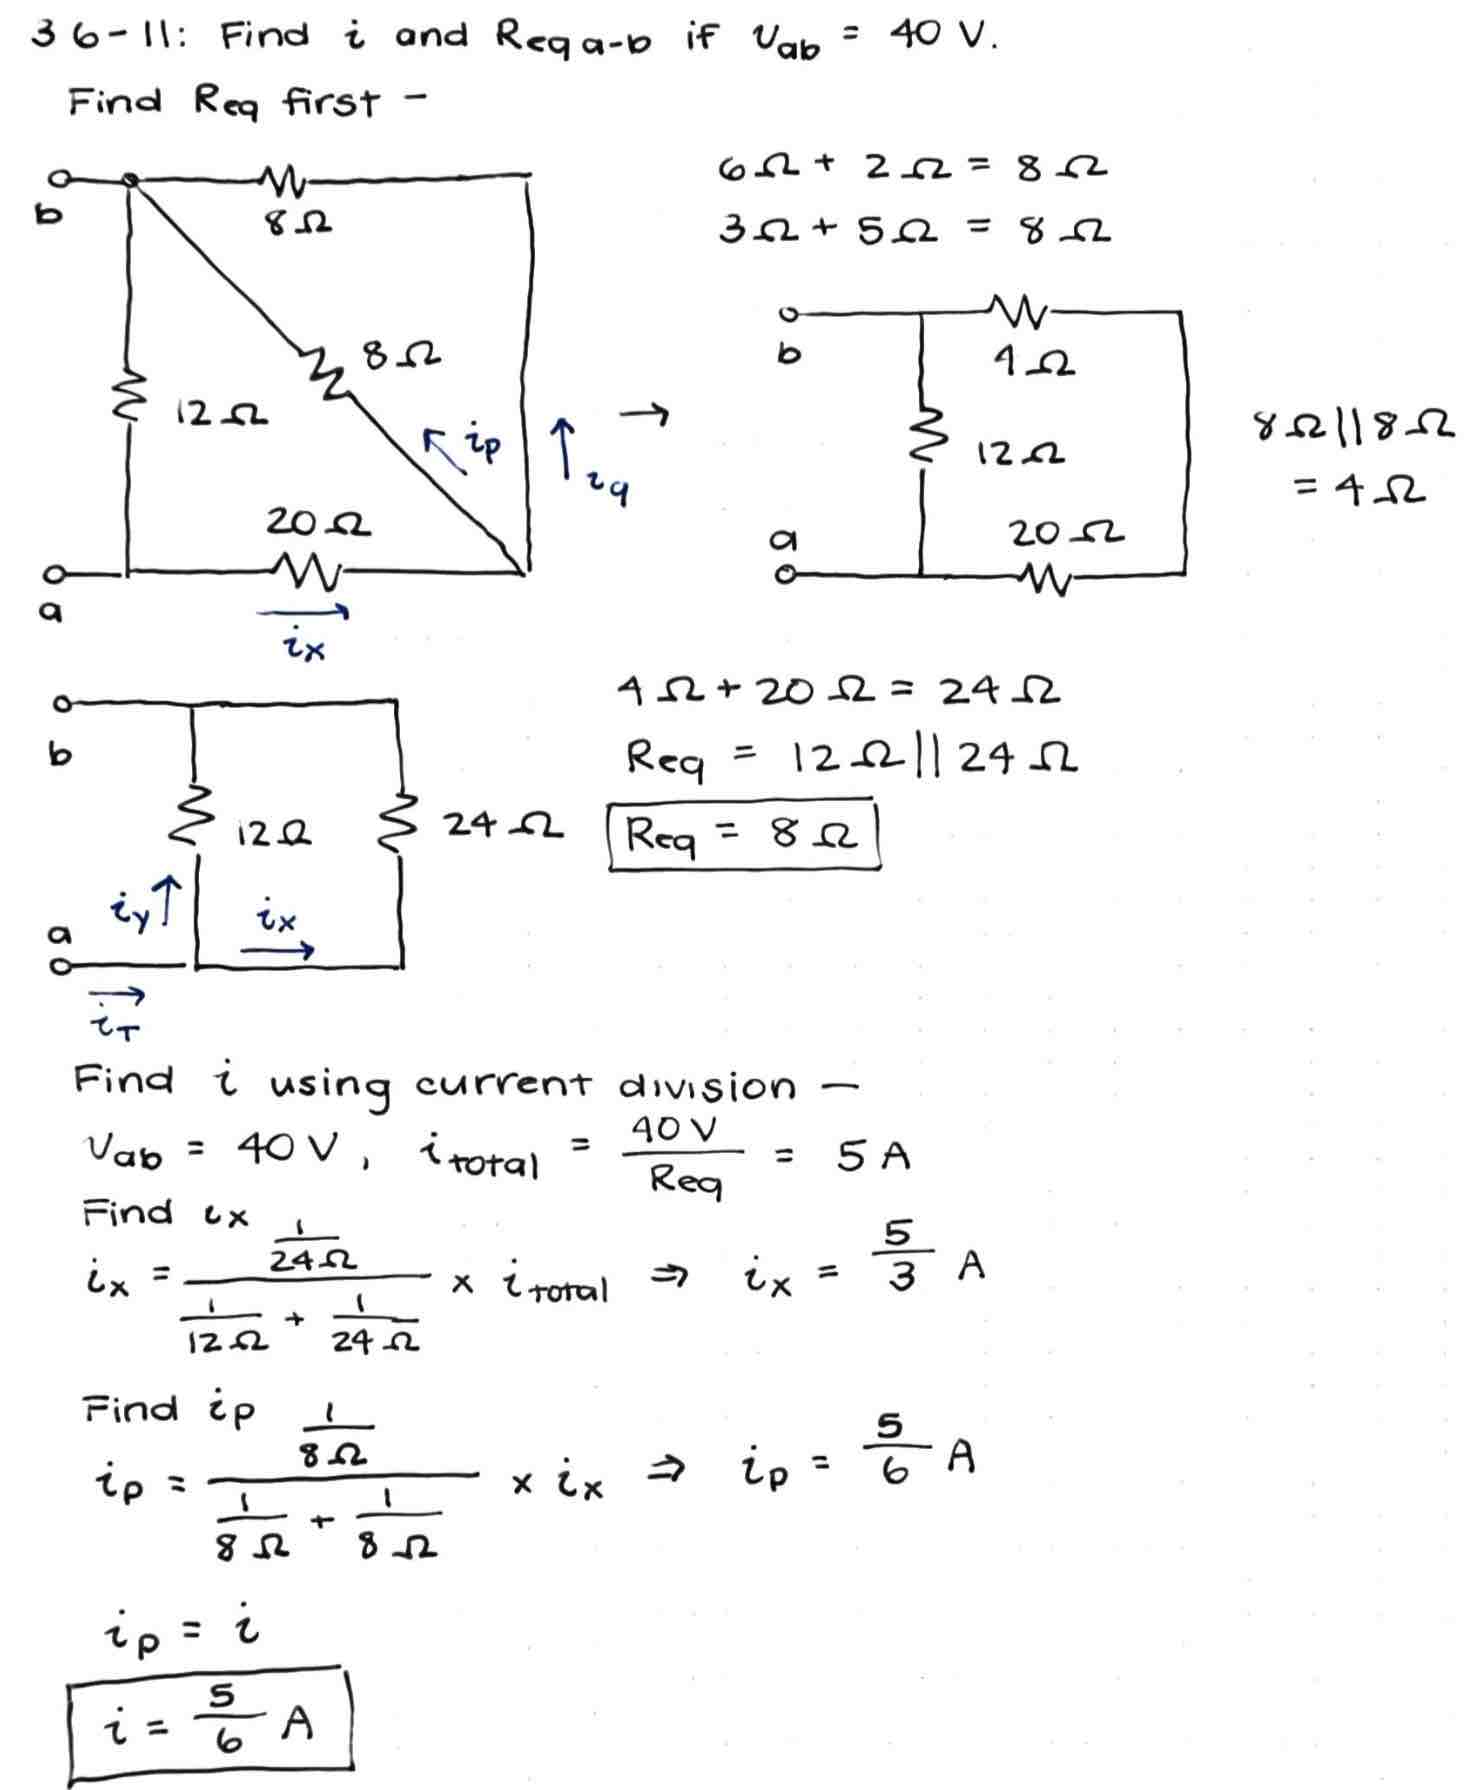
3.6-11,
Solution,
7.4-6,
Solution,
7.7-6
Solution
- Set 2, Due Sept 8:
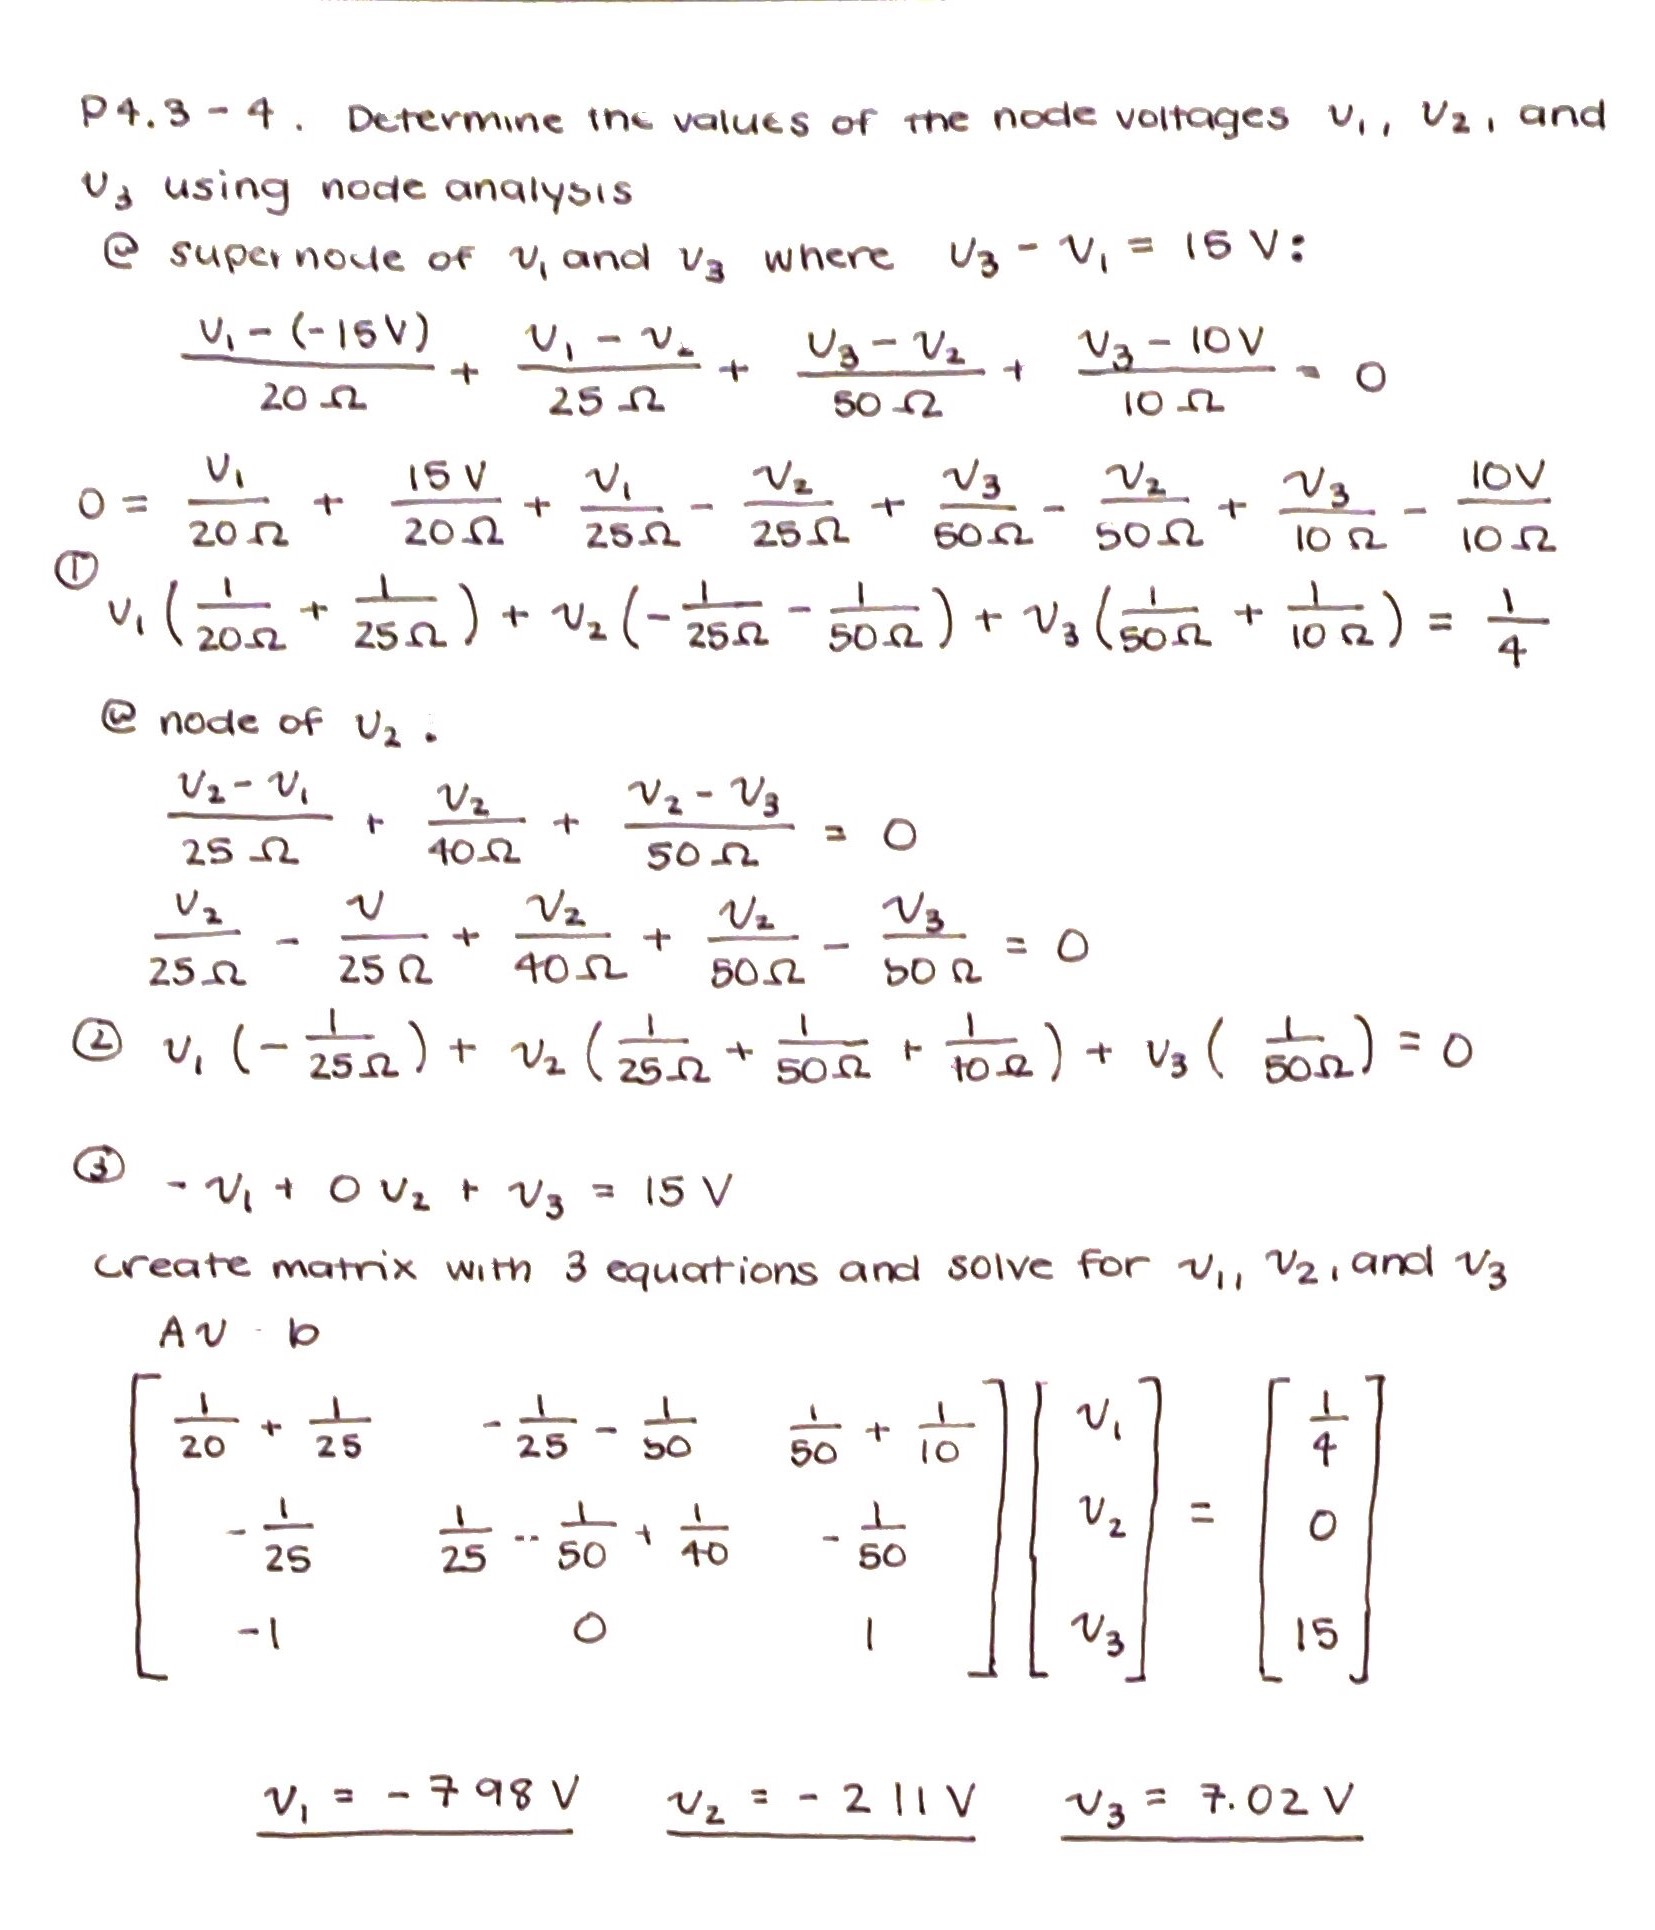
4.3-4 (solve by node equation),
Solution,
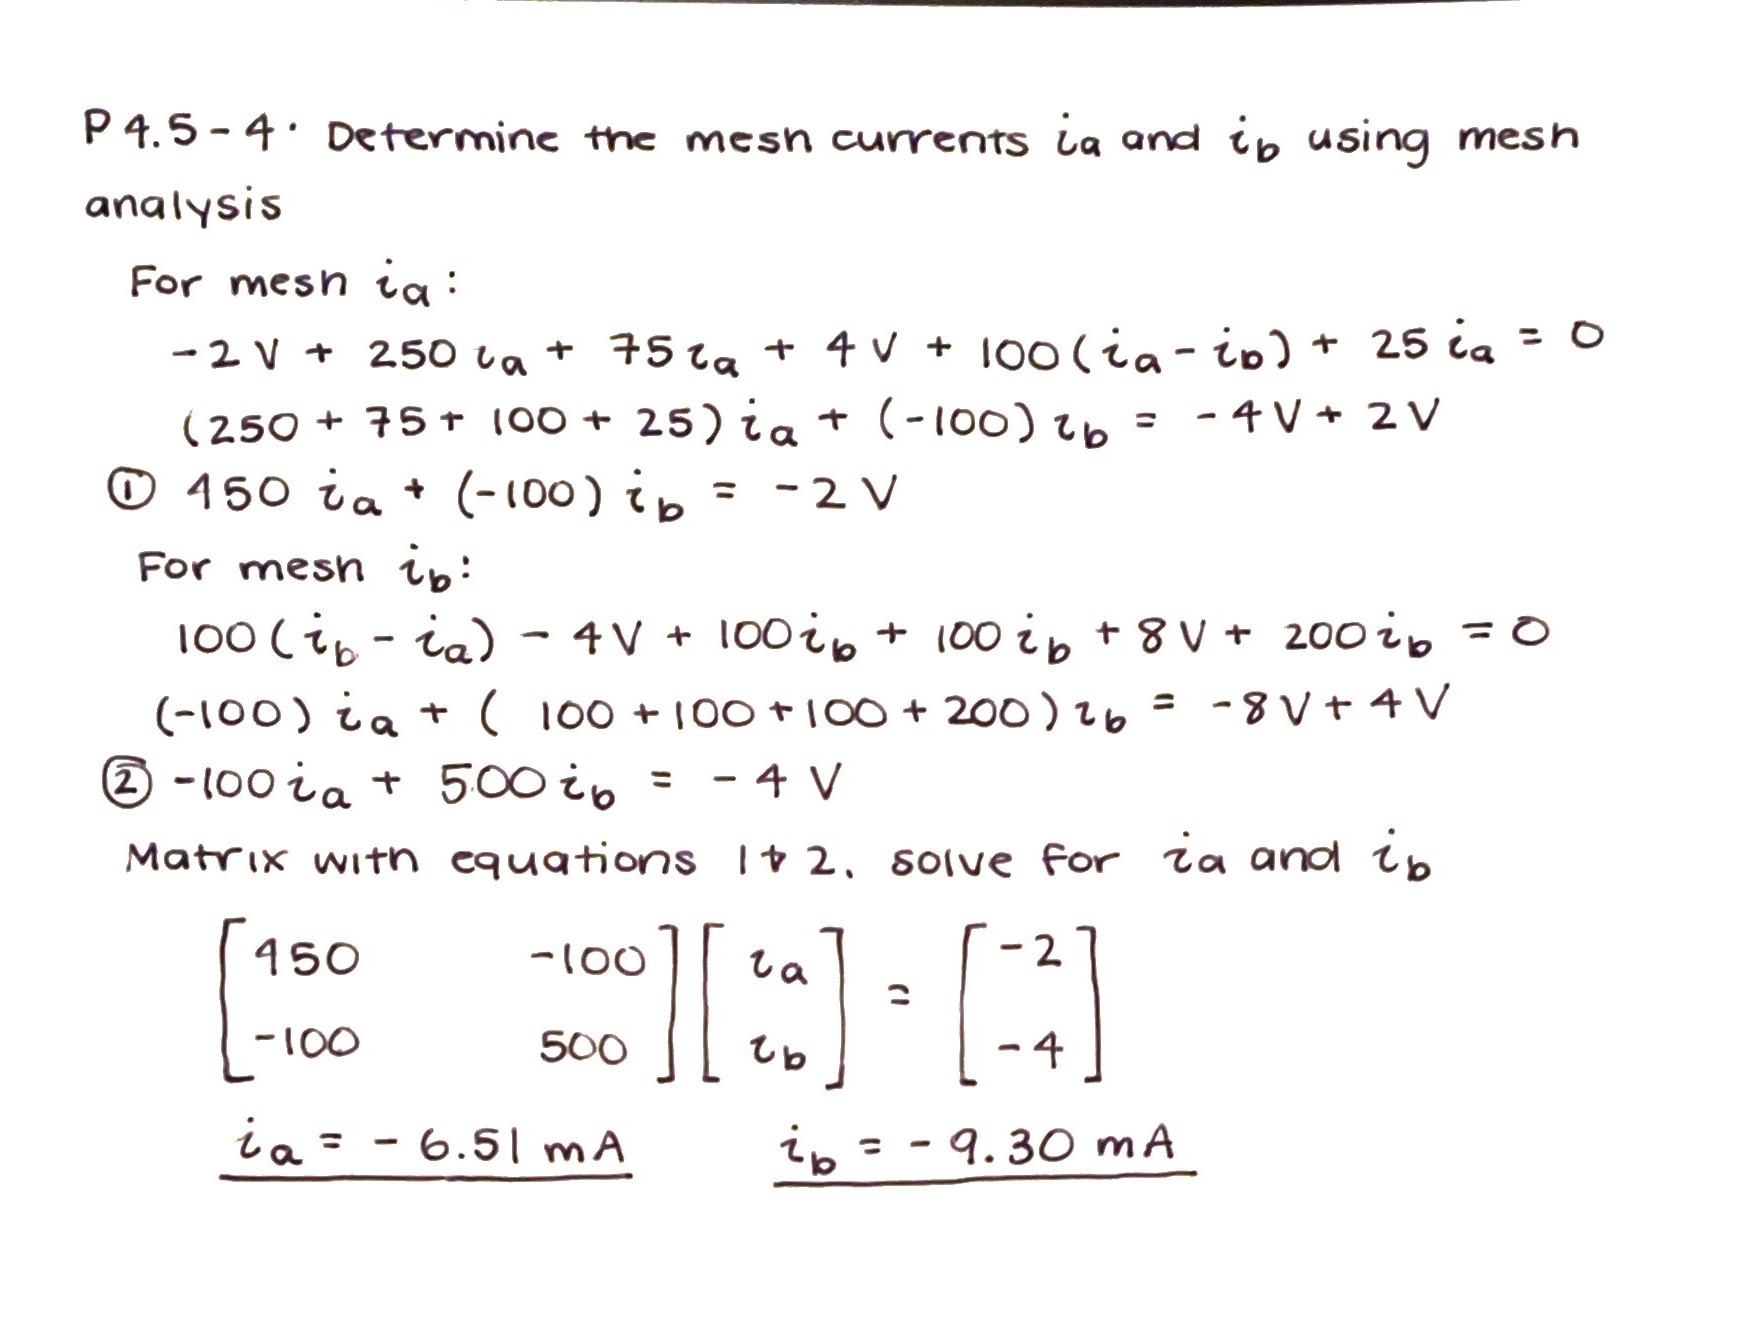
4.5-4 (solve by mesh equation),
Solution,
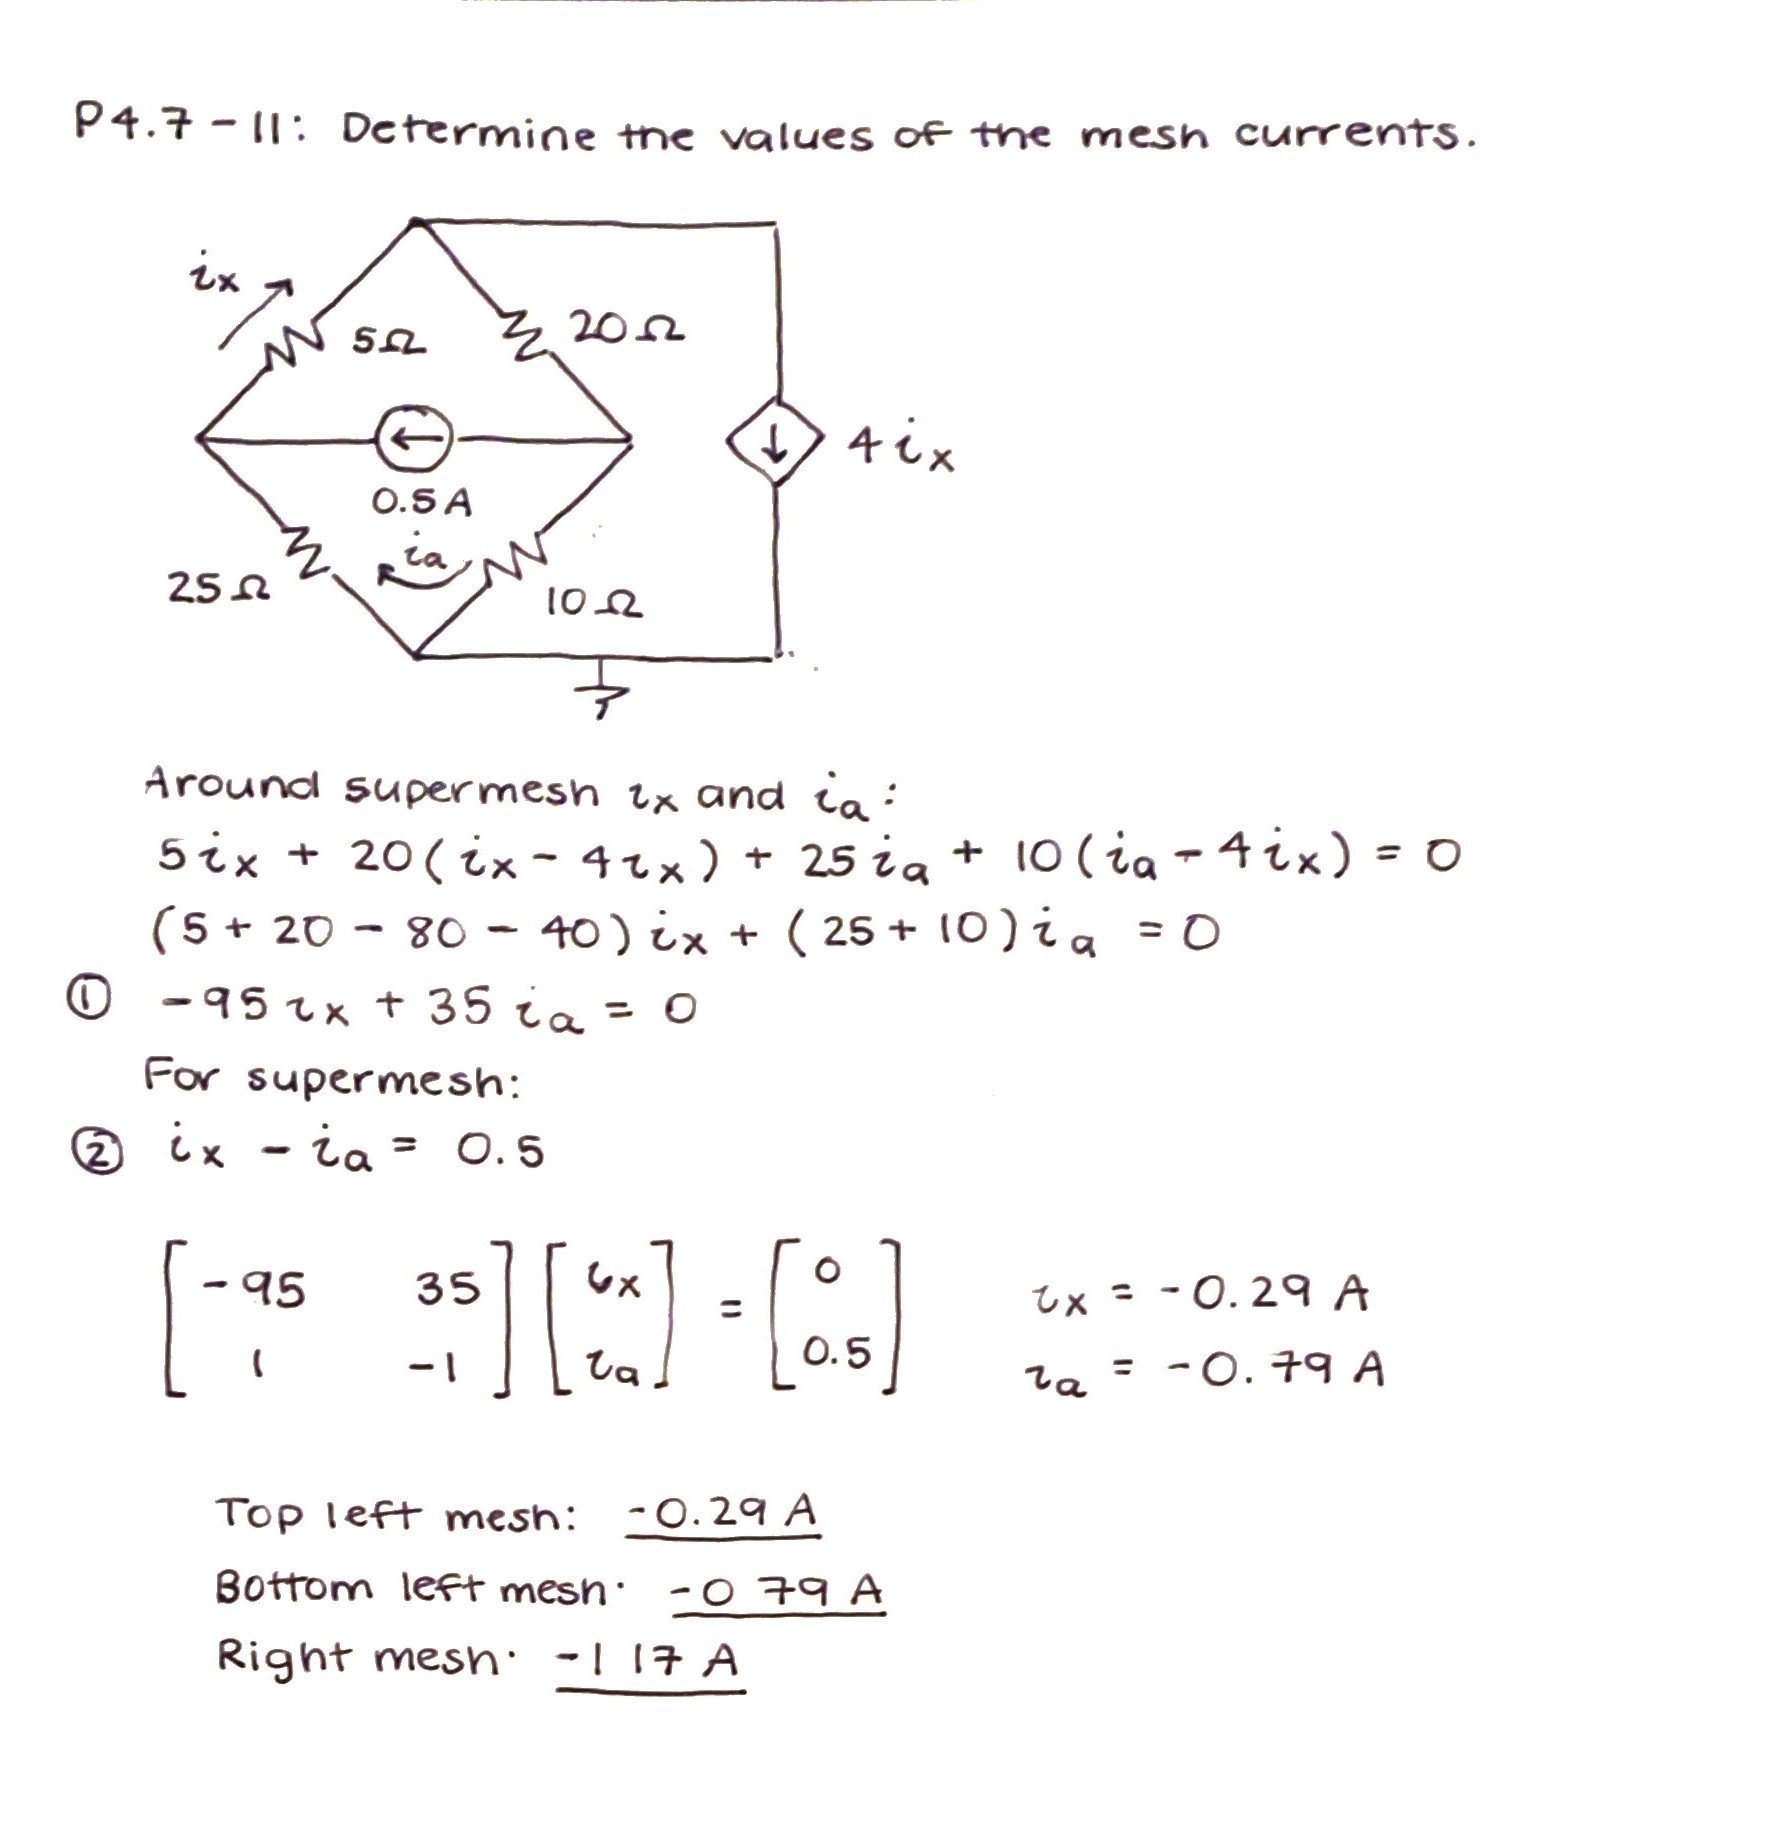
4.7-11,
Solution,
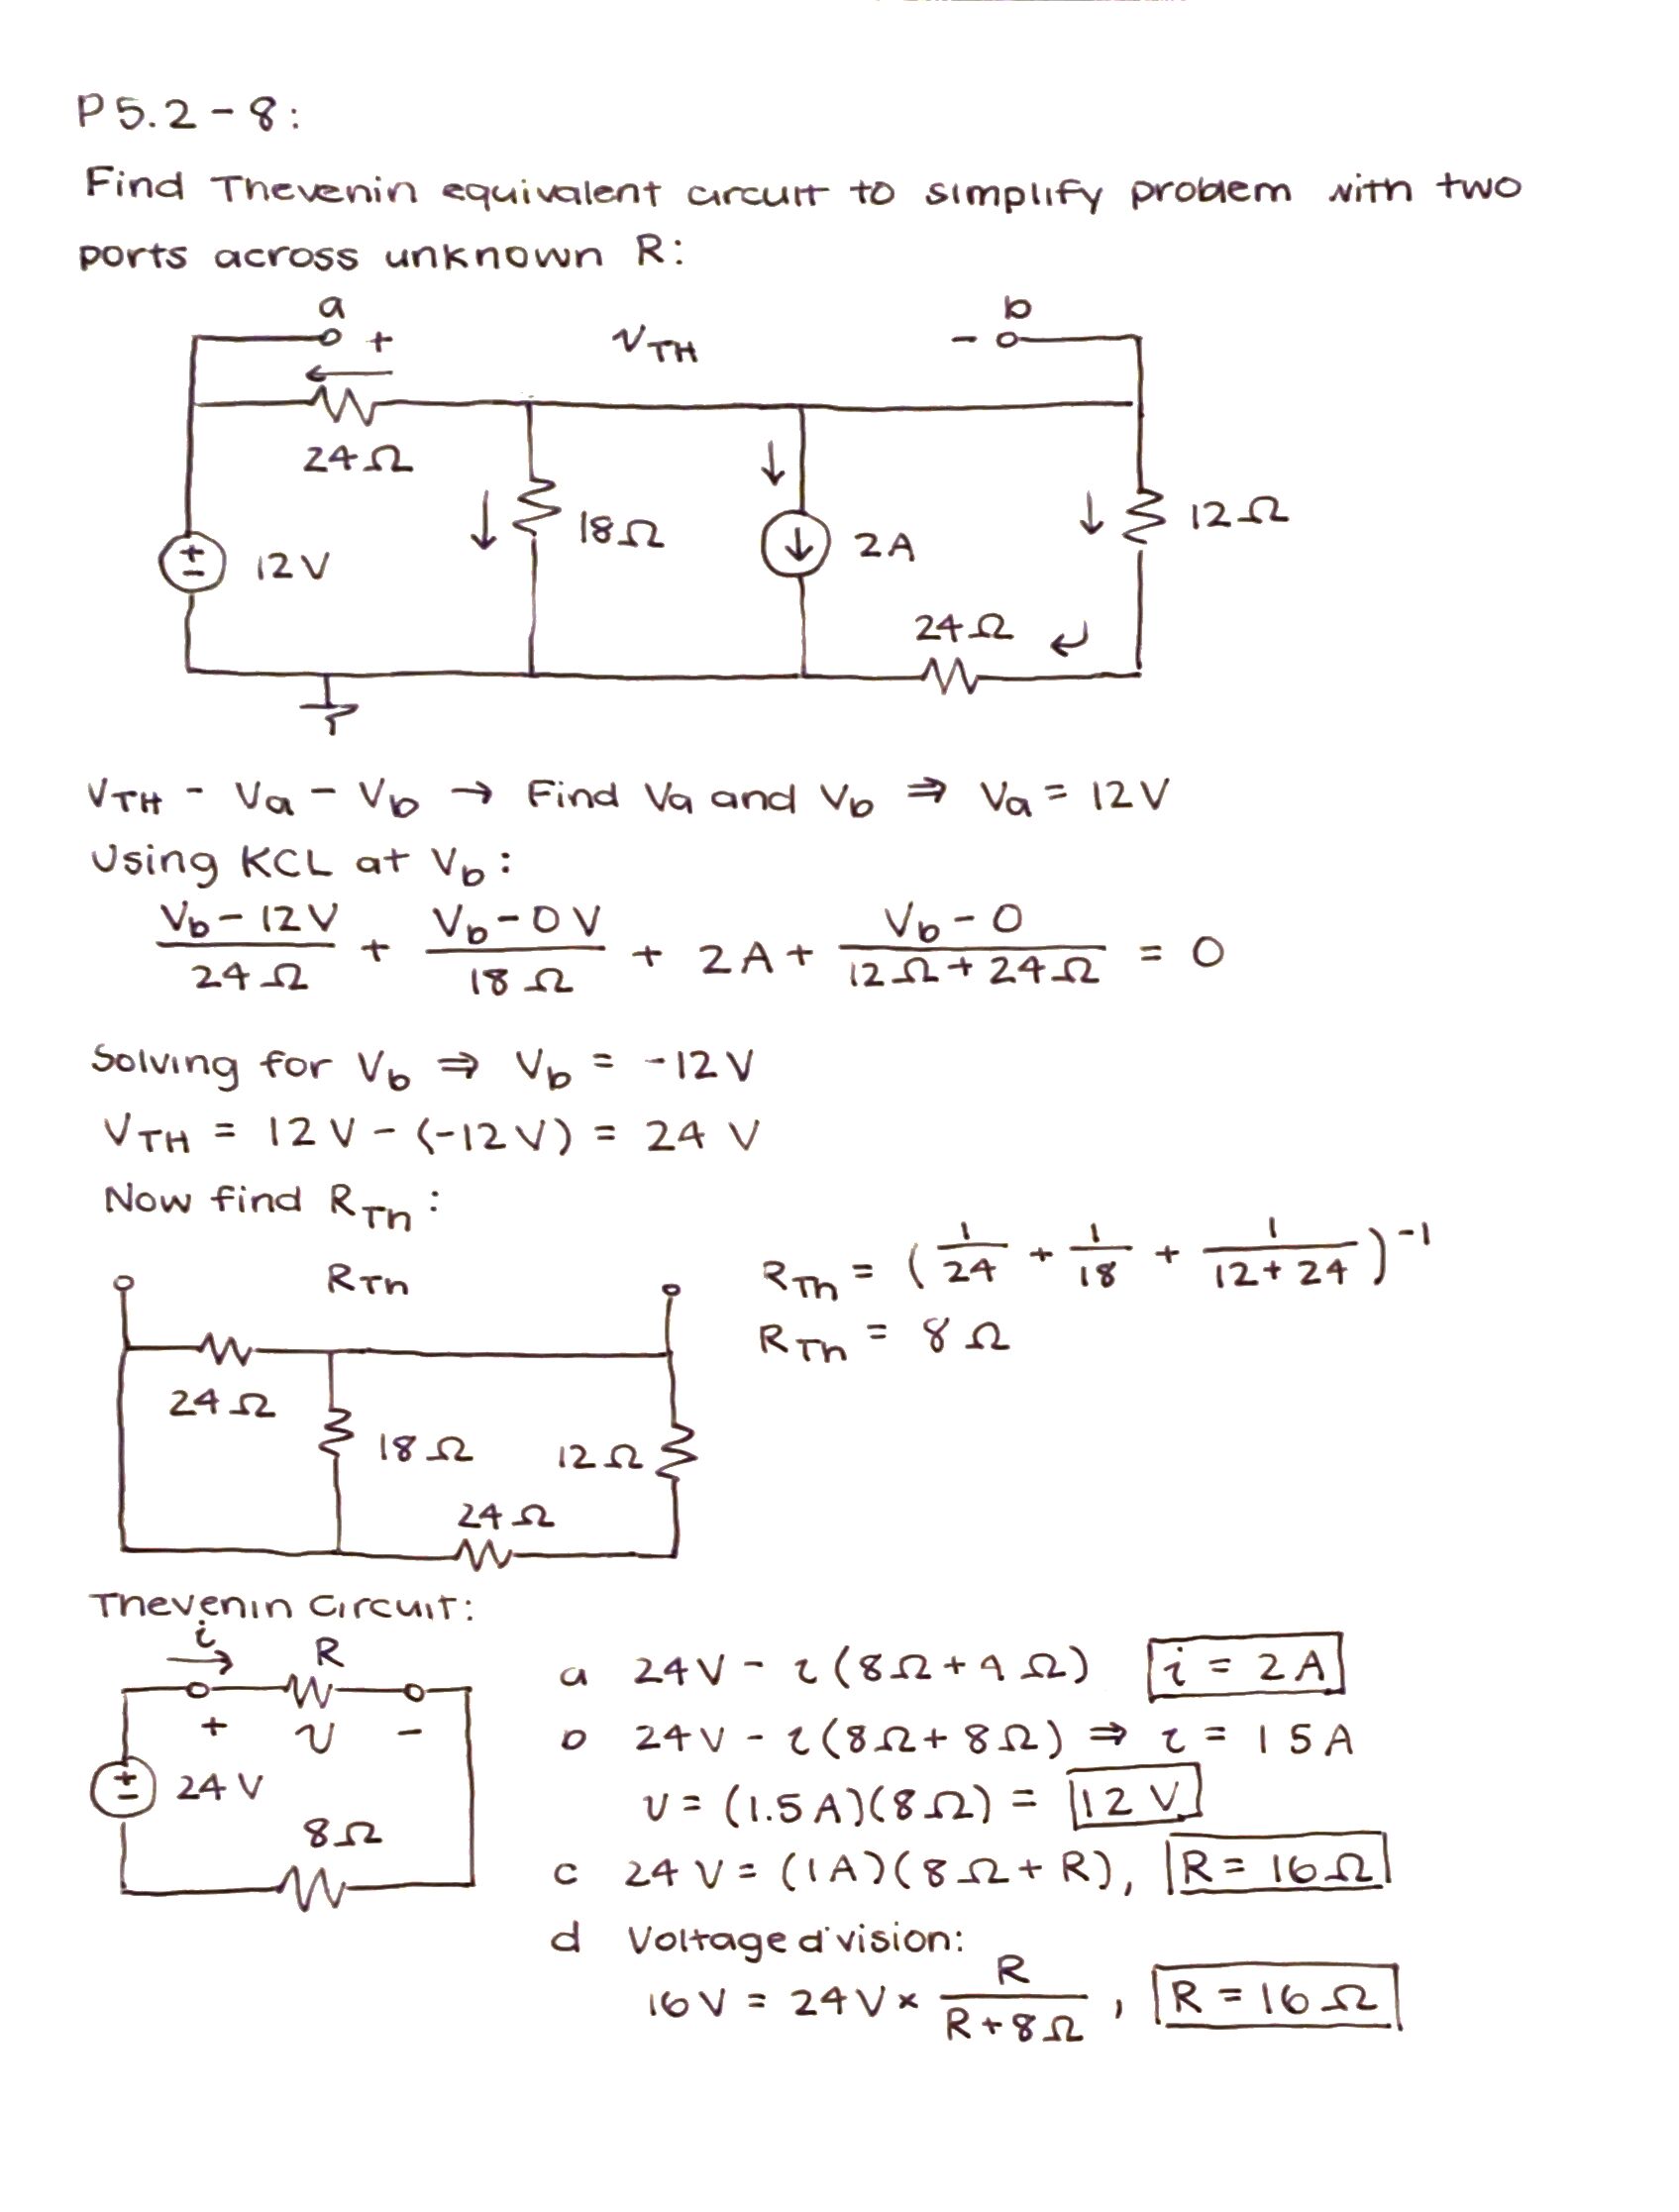
5.2-8,
Solution,
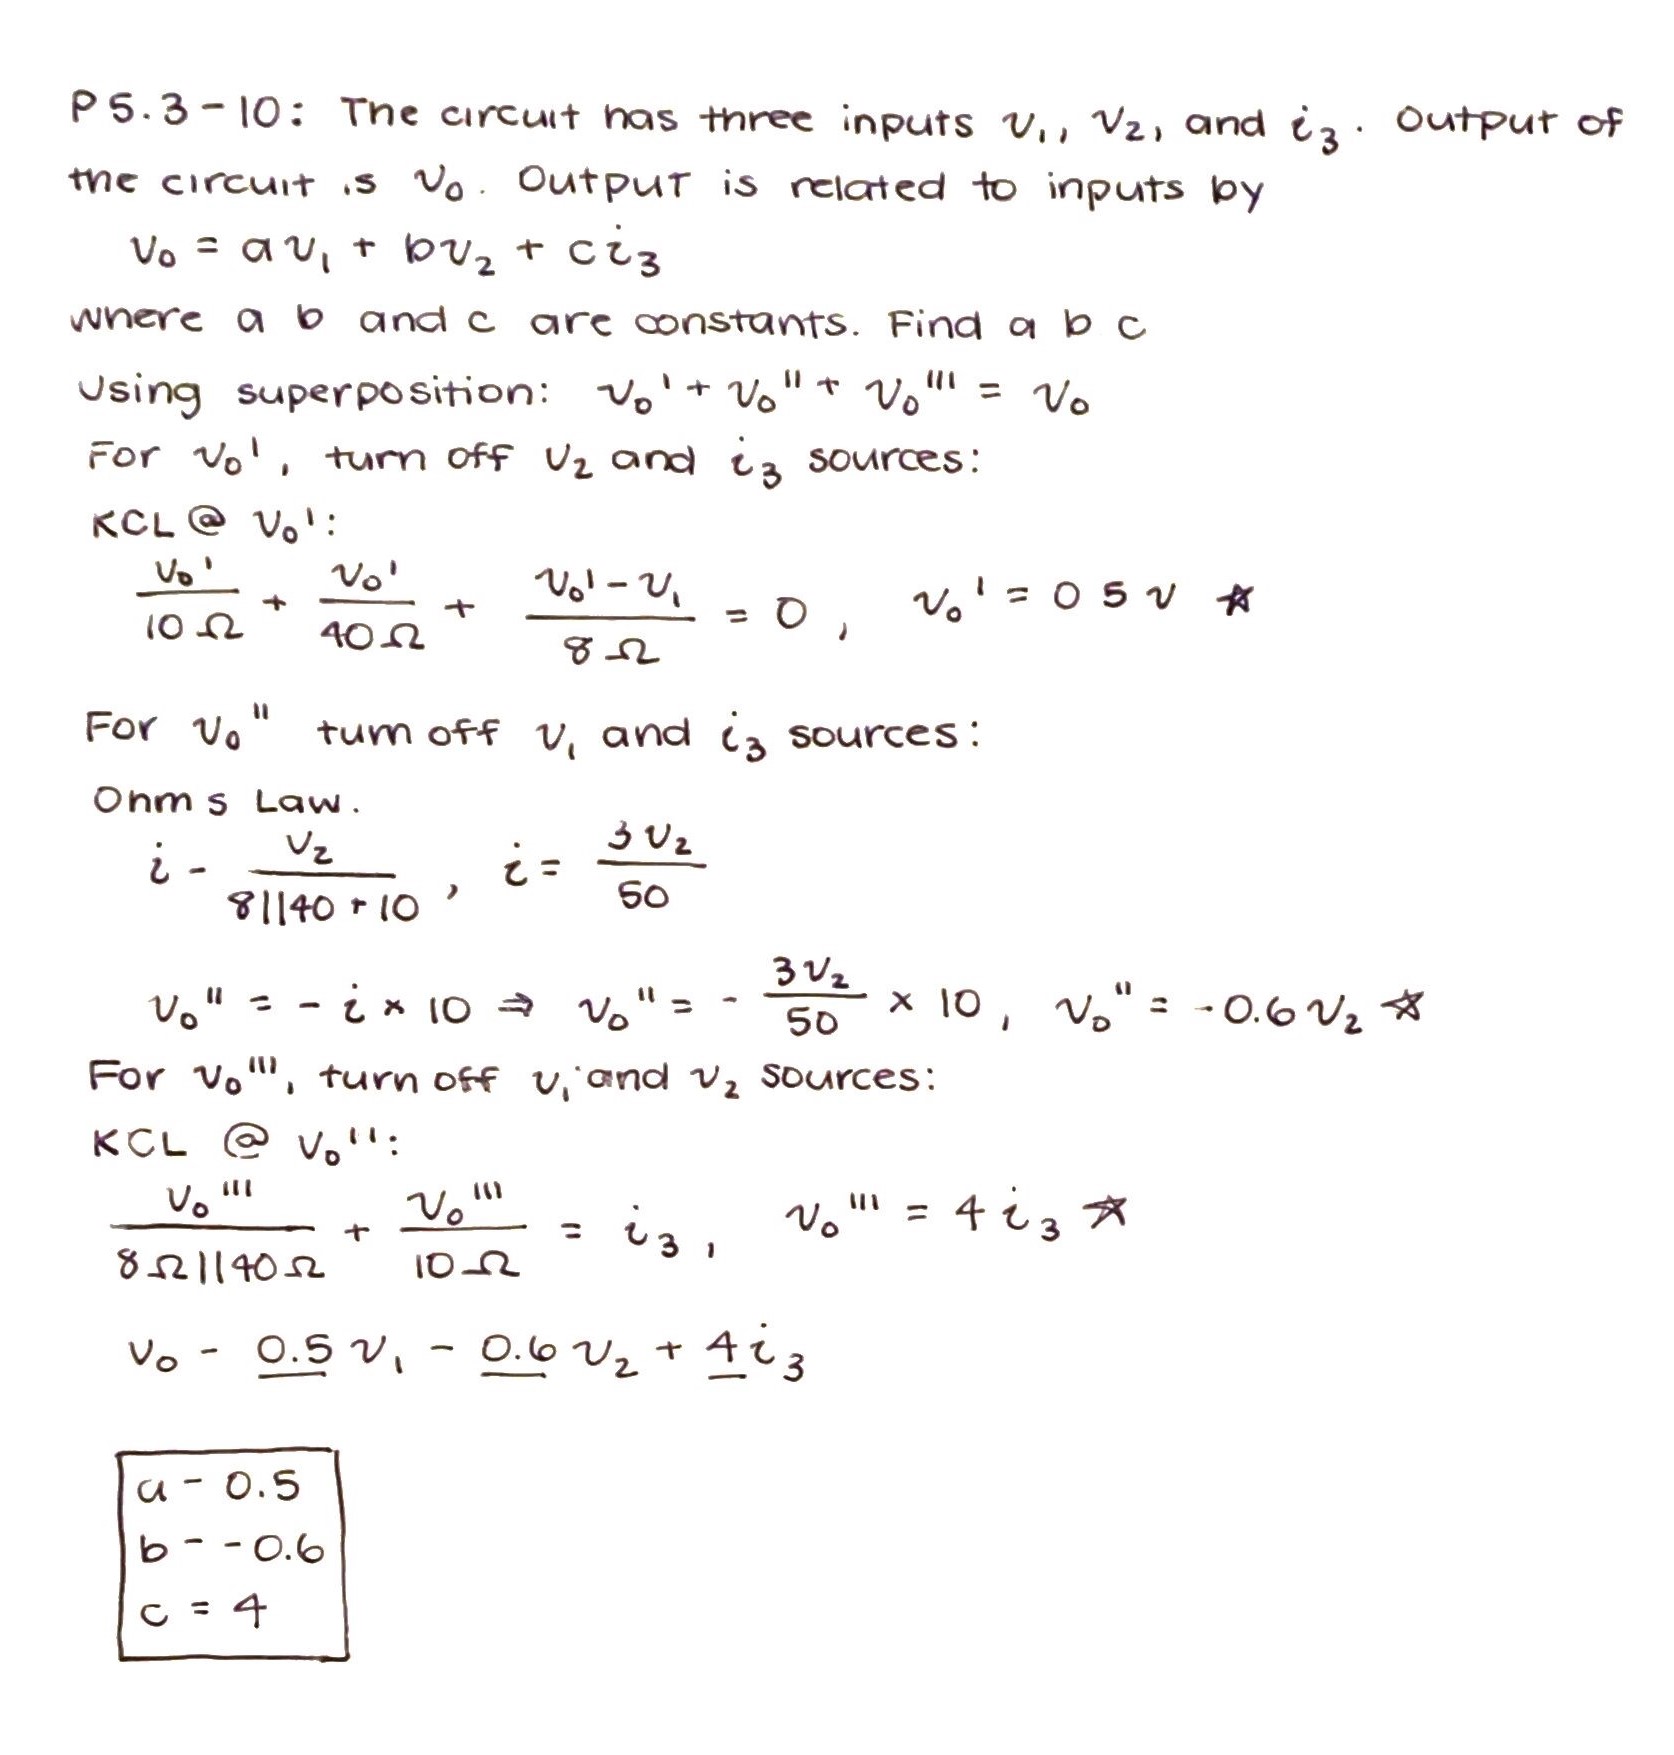
5.3-10,
Solution,
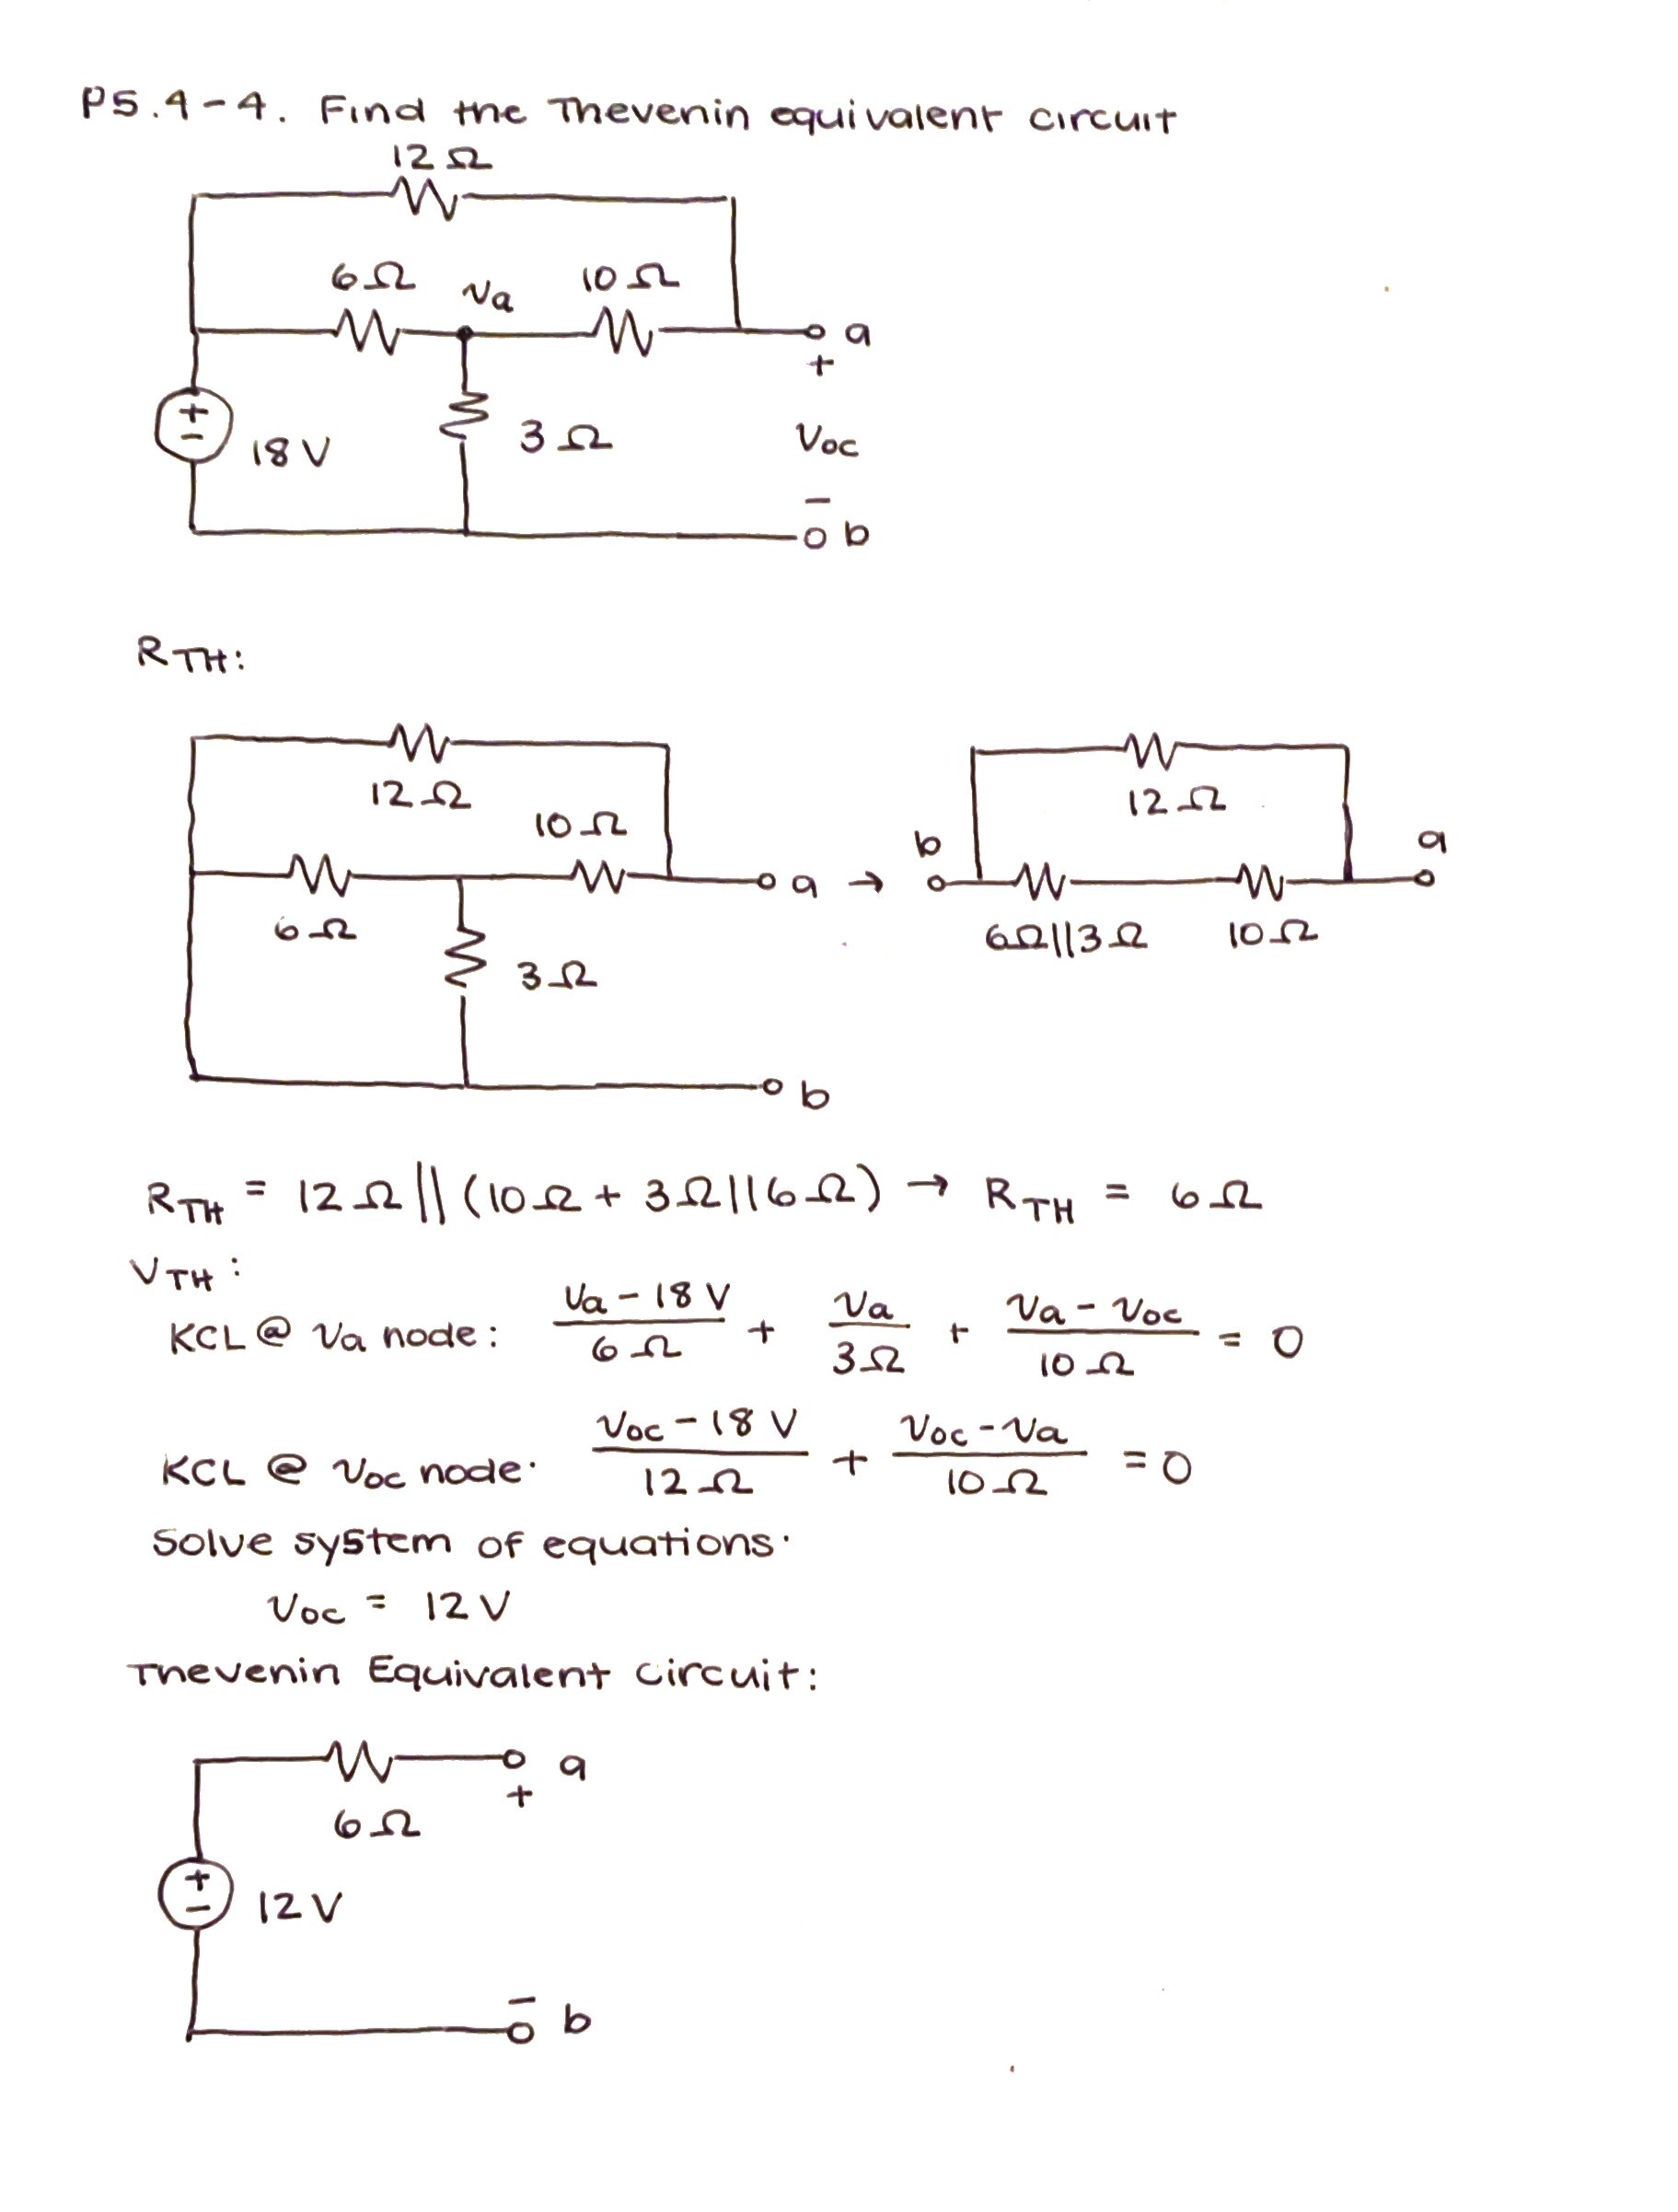
5.3-15,
Solution,
5.4-4,
Solution,
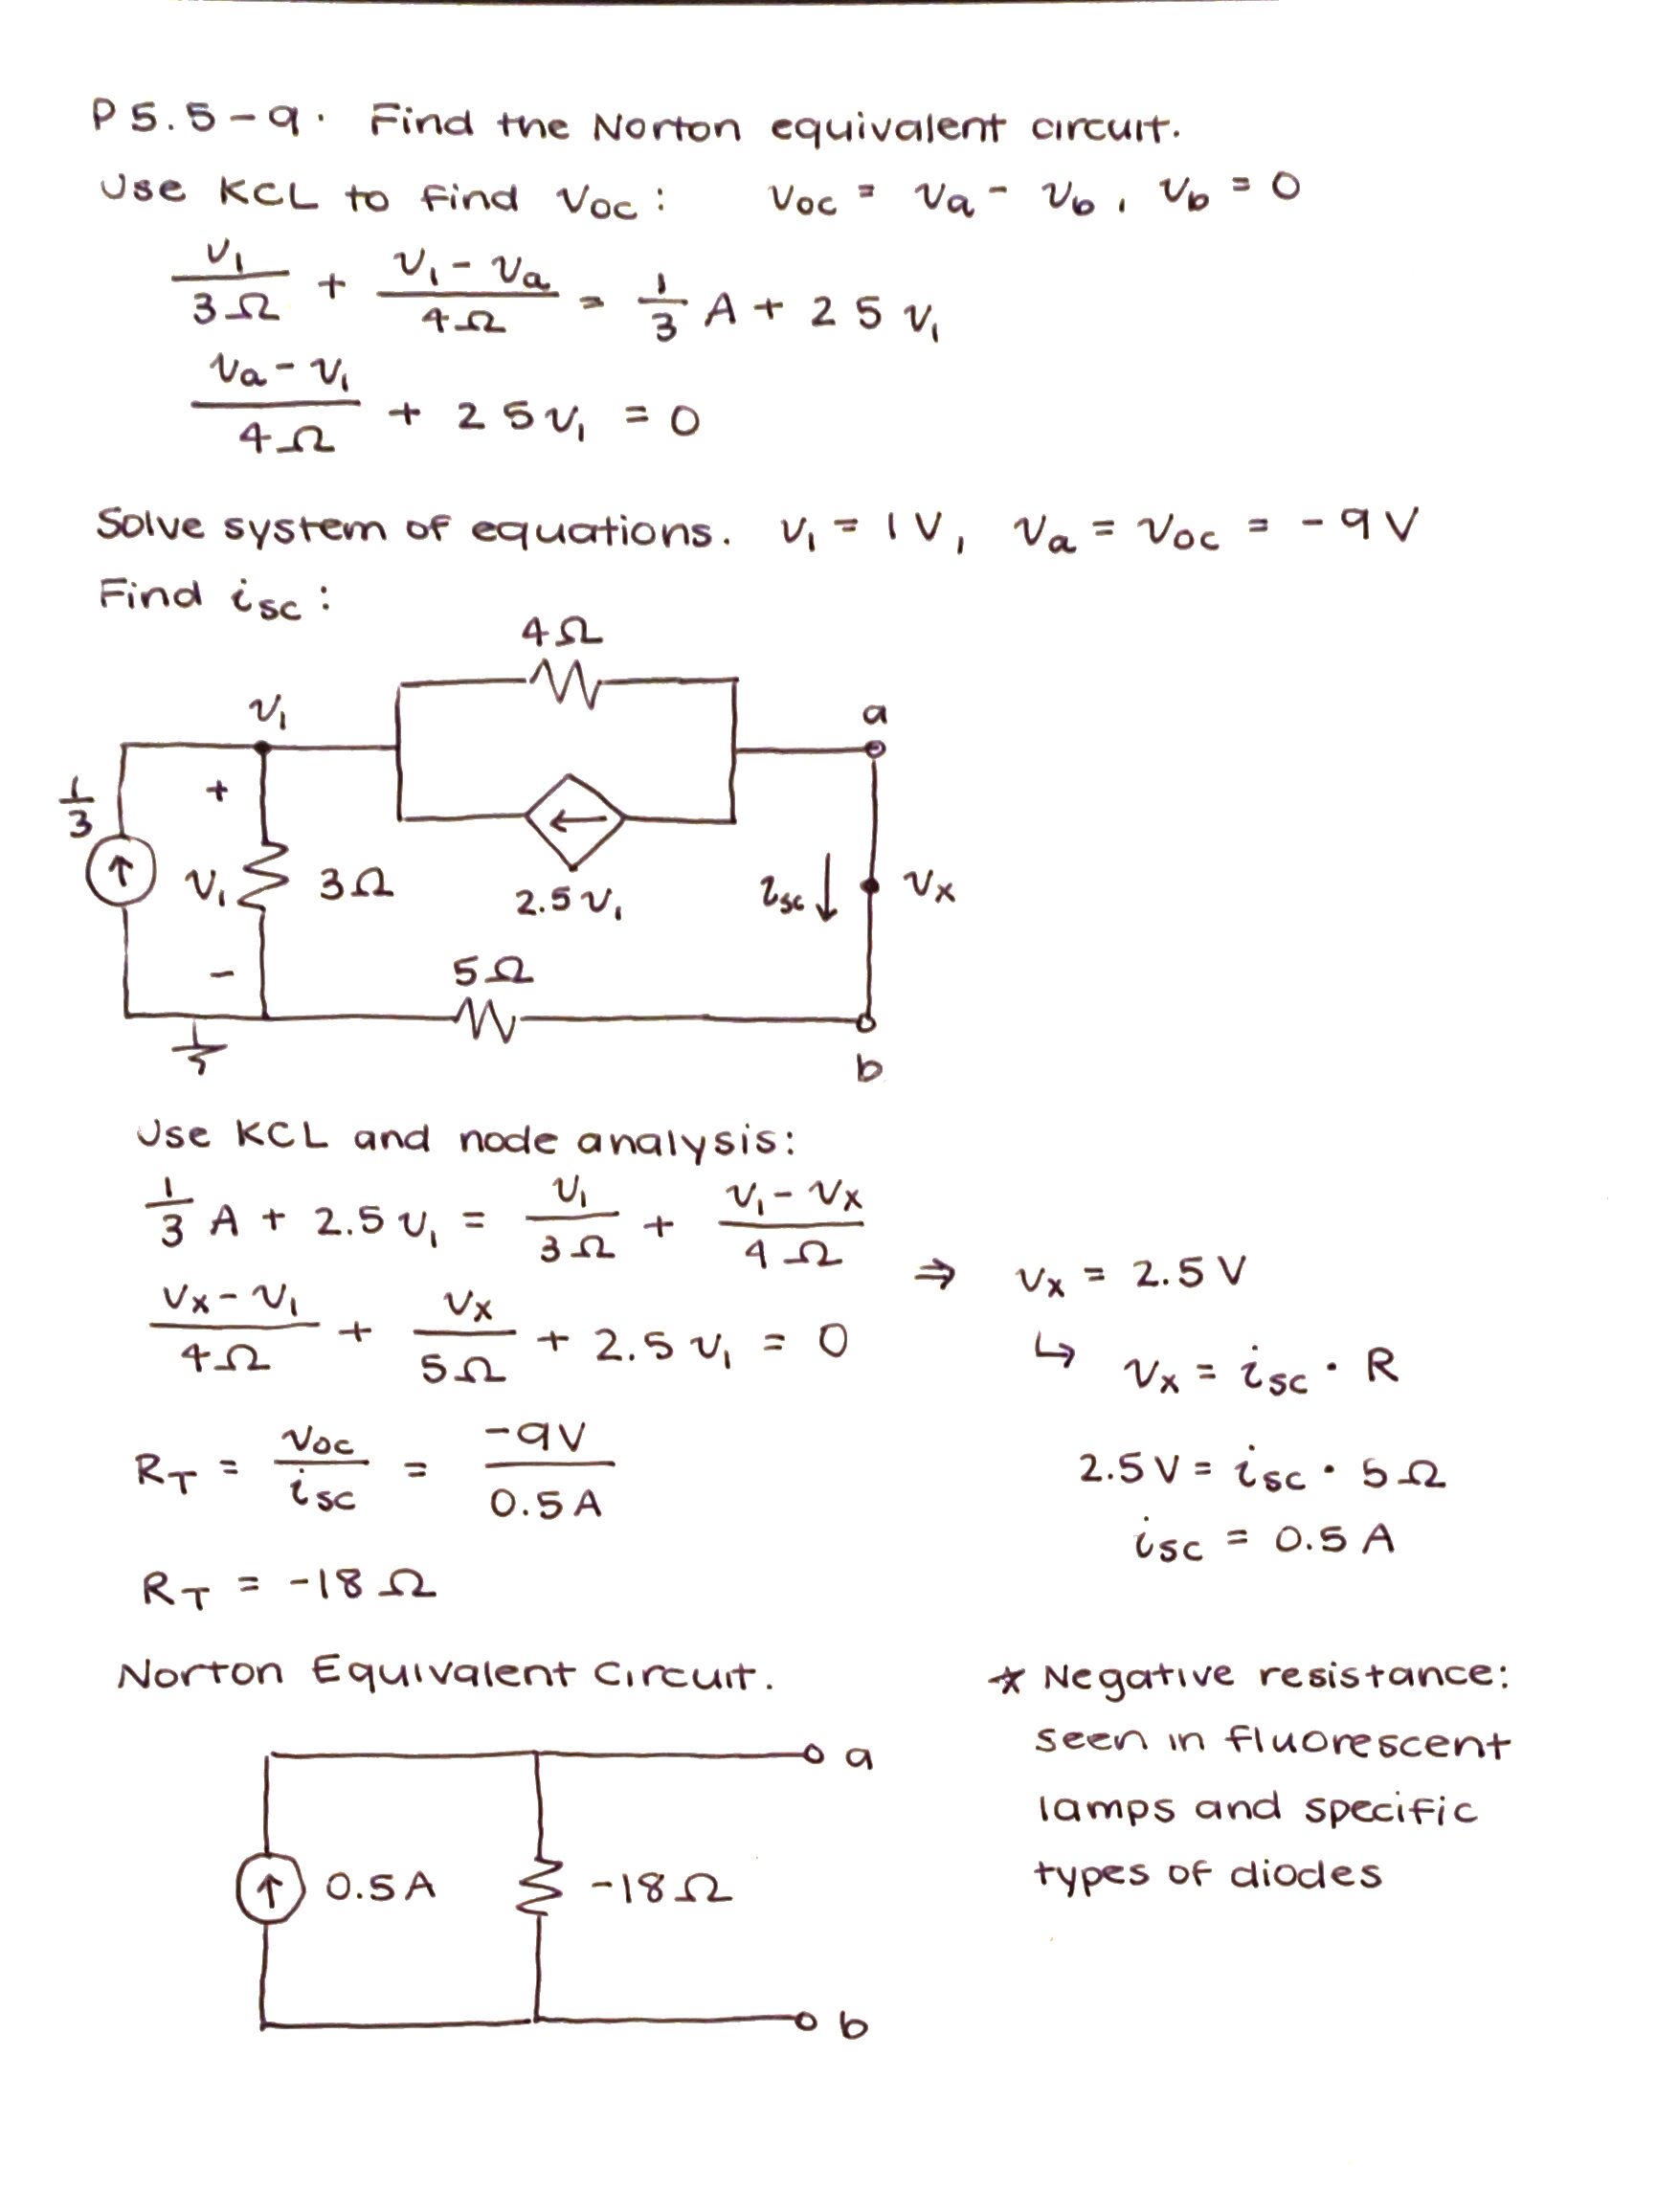
5.5-9,
Solution,
Previous Problems and Solutions
You are expected to work through these problems during this unit.
The solutions are provided.
You should attempt these problems before attempting the submitted homework problems.
You should not submit any of these solutions.
Practice solving linear circuit problems tends to be very important to learning this material well.
- P.3.2-2,
Solution,
- P.3.2-25,
Solution,
- P.3-2-29,
Solution,
- P.3.3-4,
Solution,
- P.3.3-5,
Solution,
- P3.3-15,
Solution,
- P3.4-1,
Solution,
- P3.4-8,
Solution,
- P3.4-20,
Solution,
- P3.6-1,
Solution,
- P.3.6-3,
Solution,
- P3.6-18,
Solution,
- P4.3-5,
Solution,
- P4.4-13,
Solution,
- P4.4-22,
Solution,
- P4.7-12,
Solution
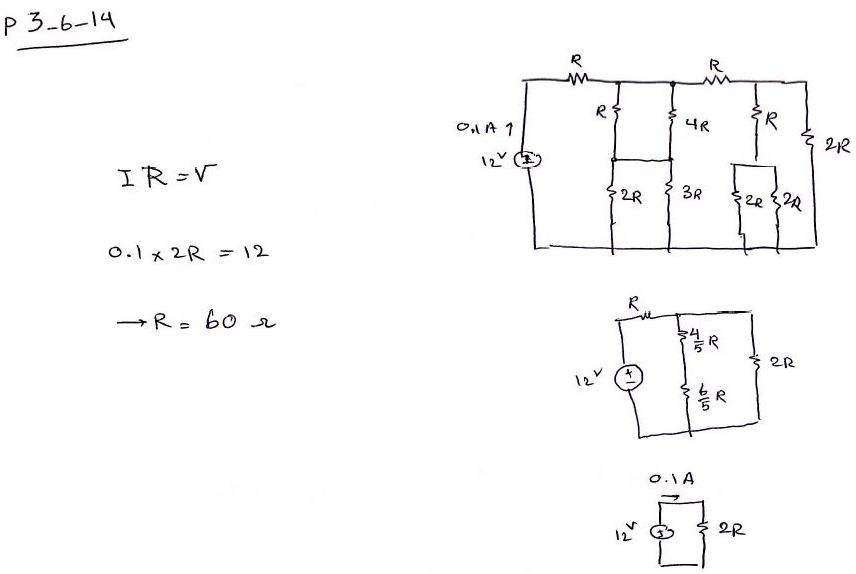
- P3.6-14,
Solution,
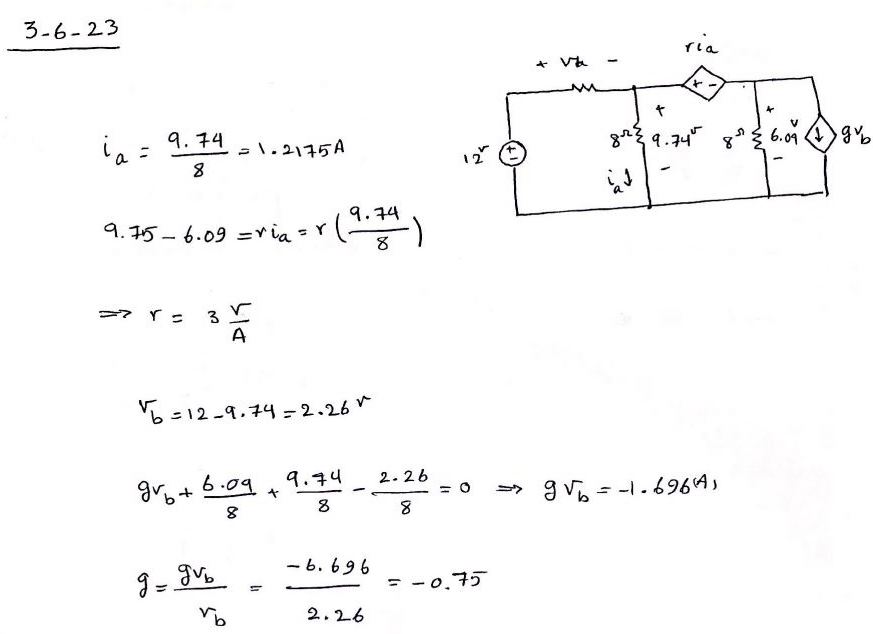
- P3.6-23,
Solution,
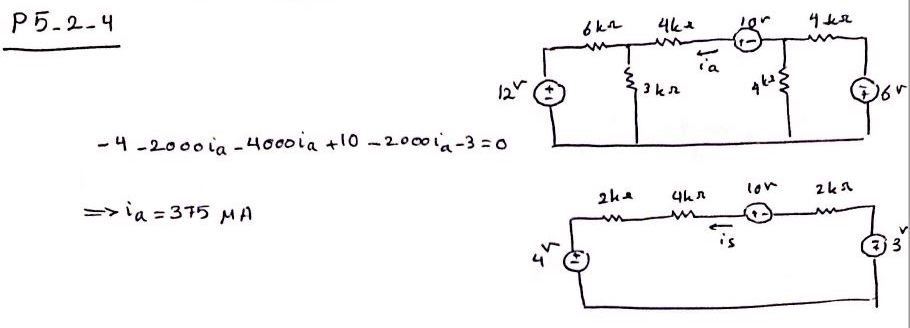
- 5.2-4,
Solution,
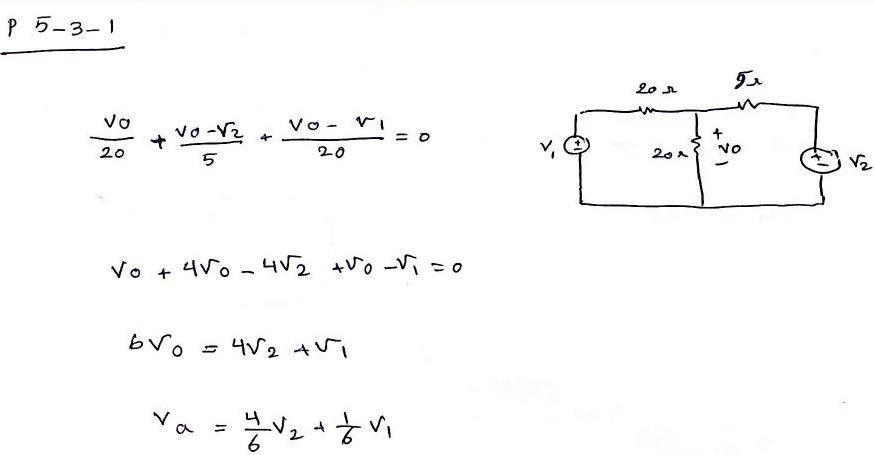
- 5.3-1,
Solution,
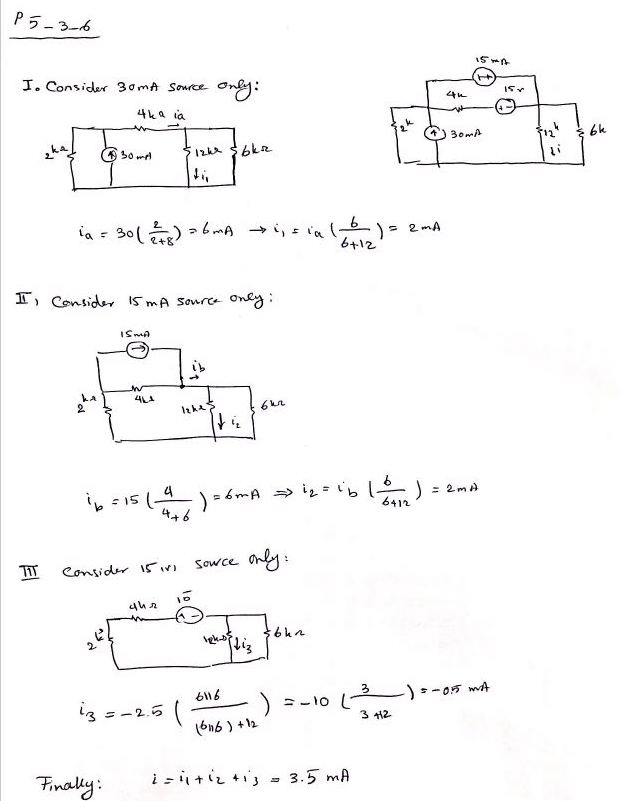
- 5.3-6
Solution,
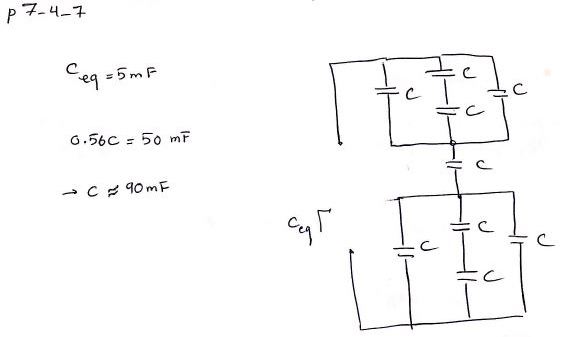
- 7.4-7,
Solution,
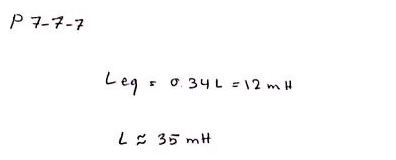
- 7.7-7,
Solution,
- 5.3-9,
Solution,
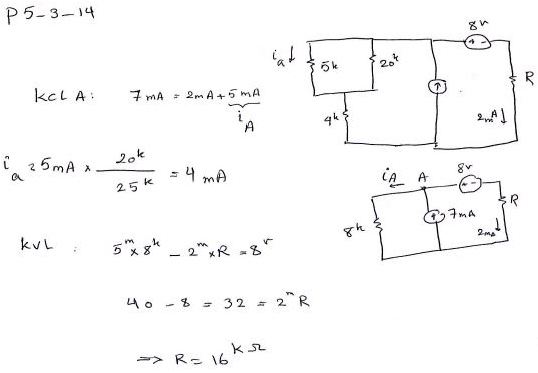
- 5.3-14,
Solution,
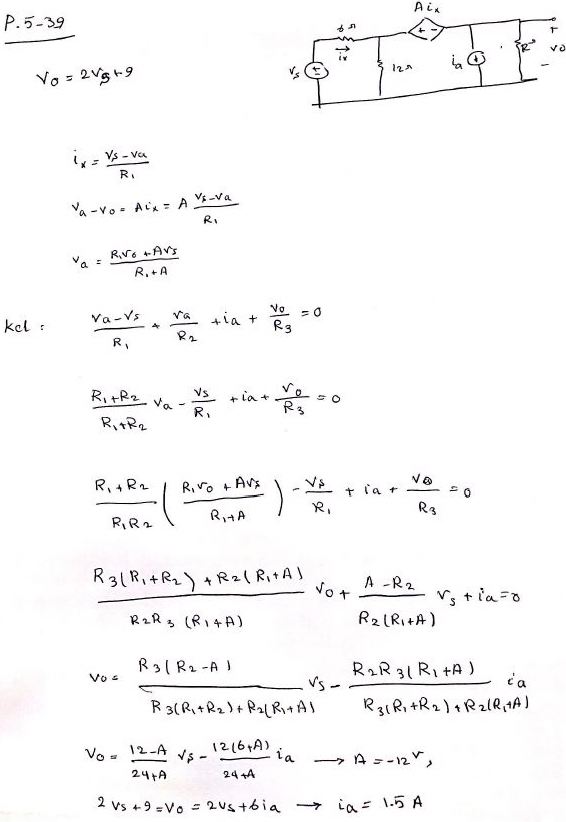
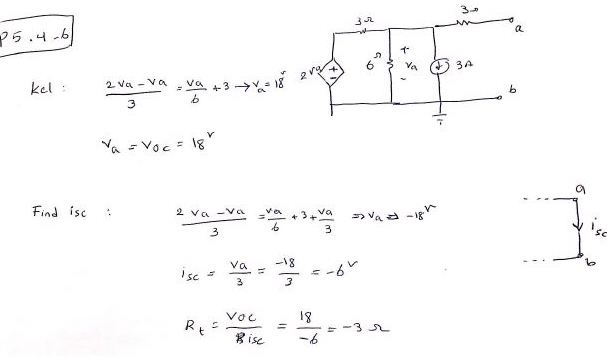
- 5.4-6,
Solution,
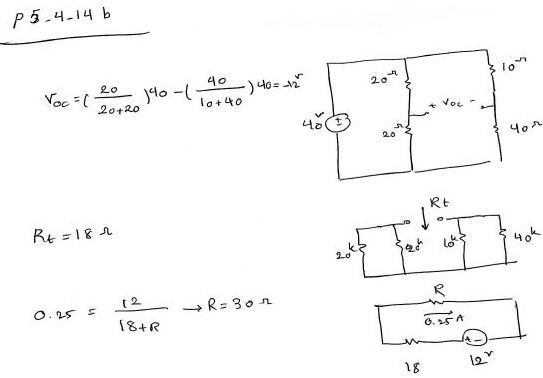
- 5.4-14b,
Solution,
- 5.5-4,
Solution,
- 5.5-8.
Solution,
Project Items
This project primarily gets the students comfortable with measurement and resulting analysis of
resistive circuits.
Part of this lab is that you get familiar with your tools, measuring data, and getting data
to a place where you can analyze it and write it up.
Remember plots and data analysis are done in MATLAB / Scilab; please don't include your code in your writeup.
You will submit one writeup per group electronically to the professor
(both individuals may submit the same report twice in Canvas if both names are on both documents).
Preferred naming of the submitted document: "Project1_LastName1_LastName2".
|
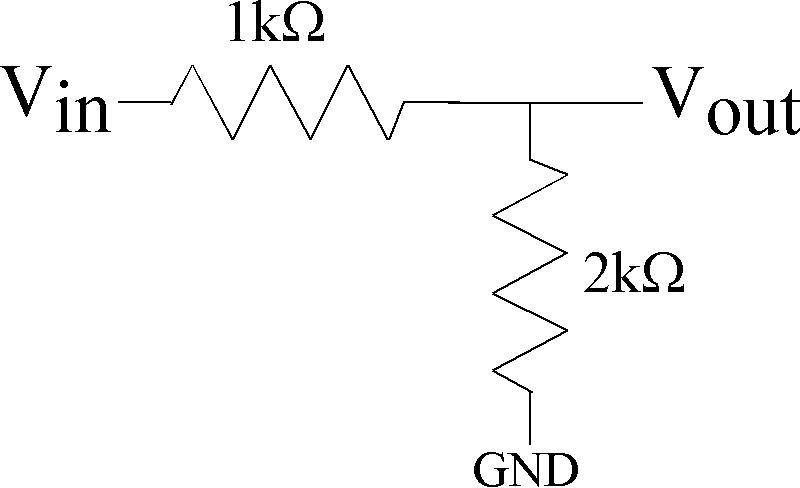
Figure 1: Resistive divider circuit for lab measurement.
|
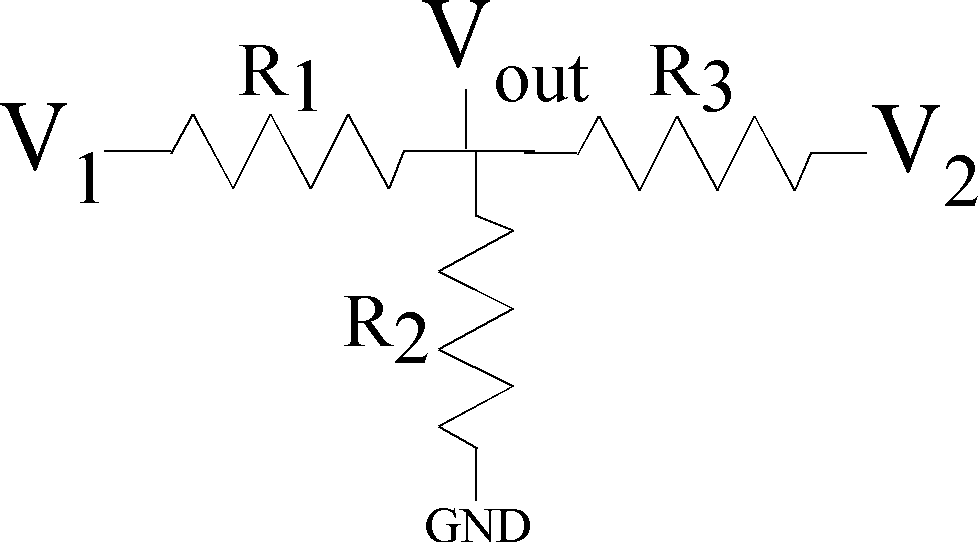
Figure 2: A resistive circuit with two voltages to illustrate
the linear behavior of resistive circuits.
|
- Set a resistive voltage divider using resistive components (Fig. 1).
If for some reason you have resistor values slightly different than 1kOhm or 2kOhm,
please identify the expected resistor value from the resistor codes.
Sweep the input voltage (Vin) from 0V to 3V or 5V taking roughly 100 points,
and measure the output voltage (Vout).
From your measured data, make a linear curve fit to this data
to find the ratio between R1 and R2 from this data.
You will want to use MATLAB for this operation and plotting,
using the functions polyfit and polyval
(on-line lectures from ECE1371 on this function
are useful to
watch
if you have not used these functions previously.)
The curve fit will give the gain (which you should identify),
the ratio of the output voltage to the input voltage.
I expect a plot with your measured data (say as 'o' points)
and the curve fit on the same plot .
You might measure an offset voltage from the curve fit.
Do you expect an offset theorectically?
You should discuss what
might be causing this value.
Calculate the ideal value of this ratio and compare your results.
After getting these results,
measure the value of R1 and R2
using your data aquisition device or similar device if you have something available.
Compare the resistance values with the indicated tolerances from the resistor codes,
as well as compare the circuit gain and ratio of R1 and R2.
You will want to give a percent deviation from ideal values whereever possible,
as well as other relevant metrics.
- Using resistors that you have available of the relative size for the resistive voltage divider,
implement the circuit in Fig. 2,
where you use two input signal voltage sources for V1 and V2.
Do not make all of the resistors the same values.
Do a sweep and curve fit for V1 when V2 = 0 (GND),
and
do a sweep and curve fit for V2 when V1 = 0 (GND).
Compare the values of the slopes to the resulting resistors used in this circuit,
similar to the voltage divider above.
- Using this circuit (Fig. 2),
do a sweep and curve fit for V1 when V2 = 1V,
and do a sweep and curve fit for V2 when V1 = 1V.
Did the slope change significantly with both voltage signals applied?
What was the new offset voltage, and how does this relate to the circuit network
(circuit analysis is expected for this answer).
How are these results consistent with the fact we are dealing with linear circuit elements?
How could one use superposition to explain these circuit effects?
If the resistors were all the same value, how could you use symmetric circuit techniques for your solution?
MATLAB and Acquisition Devices
Data acquisition devices have the potential to be directly controlled by code
on your computer,
code other than the software that one installs on your device.
If one had the required interface drivers,
one could use MATLAB to directly control a particular data acquisition device.
These techniques are possible for both the Analog Discovery and myDAQ devices.
With the right drivers, a range of programming languages can achieve these results.
Over the last 10 years, MATLAB has developed a data aquisition toolbox
for interfacing in such cases.
For the GT site licence, this toolbox should be included;
in general, MATLAB does not mind selling yet another toolbox.
There are other driver code approaches to interface to MATLAB,
although they take alot more work.
As one who has written a few drivers in the past,
I can state it takes work, although it can be worth it.
Some have mentioned that the MyDAQ element only seems to work with the
Data Acquisition Toolbox for Windows based machines.
Link for MATLAB DAQ aquisition documentation from MATLAB.
The following material started from contributed material
by Nickolas Lee (Fall 2020) as a way to use
the myDAQ directly with MATLAB and be controlled by MATLAB.
Having the data taken by MATLAB allows for your plots rather easy
(plots are required to be a MATLAB format; Excel type plots are not accepted).
Install the Data Acquisition Toolbox.
Applications installed include
- Analog Input Recorder
- Analog Output Generator.
Each of these applications has a library of functions.
For example for the voltage divide experiment,
one could place the ai0+ and -
around the second resistor.
One can easily measure voltages up to 5 volts.
The Matlab code used is below.
Analog Input Recorder was used to record the results.
The first function will send 0 - 5 volts over 10 seconds.
d = daq("ni");
d.Rate = 8000;
n = d.Rate * 10;
output = linspace(0,5,n);
output = output';
addoutput(d,"myDAQ1","ao0","Voltage");
write(d, output);
write(d, 0);
clear d;
One can use both outputs and run them simultaneously.
saveas(stackedplot(data), "name.png") saves the graph.
d = daq("ni");
d.Rate = 8000;
n = d.Rate * 10;
output1 = linspace(0,5,n);
output2 = linspace(0, 5, n);
output = [output1; output2];
output = output';
addoutput(d,"myDAQ1","ao0","Voltage");
addoutput(d, "myDAQ1", "ao1", "Voltage");
write(d, output);
write(d,[0, 0]);
clear d;
In response, we had some additional useful comments from
Xinpei Ni on using he myDQA directly with MATLAB.
The following material started from that material:
To read the data from MyDAQ to our computer,
the following code
collects and saves the data in MATLAB's timetable format.
d = daq("ni");
d.Rate = 8000;
n = d.Rate * 10;
input = linspace(0,5,n);
input = input';
addoutput(d,"myDAQ1","ao0","Voltage");
addinput(d,"myDAQ1",'ai0','Voltage');
[out, st] = readwrite(d, input);
%the data read by myDAQ from the circuit is stored in out.
write(d, 0);
clear d;
The data records the voltages to
out
with respect to time, not input voltage.
You have the input voltage with time (input).
In response after lab, we had some additional useful comments from
Christopher Saetia.
The following material started from that material:
When running the code above to control the myDAQ,
one might get the error:
"Unrecognized function or variable 'daq'."
Here is a workaround:
d = daq.createSession("ni");
d.Rate = 10;
n = d.Rate * 10;
%Leads to 100 samples being taken
output = linspace(0,5,n);
output = output';
%Outputs voltage from the ao0 port
addAnalogOutputChannel(d,'myDAQ1','ao0','Voltage');
%Collects the voltage drop data by using ai0+ and ai0-
addAnalogInputChannel(d,'myDAQ1','ai0','Voltage');
d.queueOutputData(output);
d.startForeground();
clear d;
After running these lines of code (takes about 5-10 seconds),
the collected data for Vout and the supplied voltages will appear
in the workspace pane under the matrices ans and output respectively.
ans: the collected Vout data. Can copy to a new variable.
Do not forget to save the data, and make a script using the lines of code used.
You might get this warning:
Warning: Session contains channels from devices that are not synchronized because
digital triggering is not supported) when running the code.
It seems one can ignore this error.
The error of daq function not being recognized:
likely because not running the most up to date 2020 version of Matlab
(the code is very recent MATLAB additions).
To collect meaningful data,
use the myDAQ ports ai0+ and ai0- to measure the voltage across the resistor,
and ao0 and AGND (on the ao side) to provide the voltage to the power rails.
Other lab related comments
- A previous year
( Spring 2019 )
lab experiment and two good examples
( a and b )
of writeups to these experiments. I am not saying these writeups were perfect,
and yet they were good examples of the better writeups for that semester.
- For those who choose to use the MyDAC for this project,
I have a few pointer (even though I don't support this device):
-
I have not seen an explicit MyDAC function for getting a DC sweep of points.
It might be there, but I have not seen it and I have not had anyone else point me to it.
-
One solution is manually setting
recording multiple points manually
(like 40 points is around the range expected).
I know this is frustrating, but is the limitation of the software controlling the device.
-
It seems that NI (who makes MyDAC) does not enable these features,
but if you use LabView, their larger software package,
there might be ways apparently to make something work.
-
One other way to get a sweep is to put in a triangle waveform at a fairly slow speed (like say 1Hz frequency) and measure the output waveform (and record the input waveform). If you have both parts, you should be able to get the plot of output voltage verses input voltage. I think the triangle waveform + scope is likely the better approach, but either approach is acceptable (as long as it is explained).
-
Just because you choose to use the MyDAC device is not a reason not to fully
complete this project, particularly the DC voltage sweep.
|